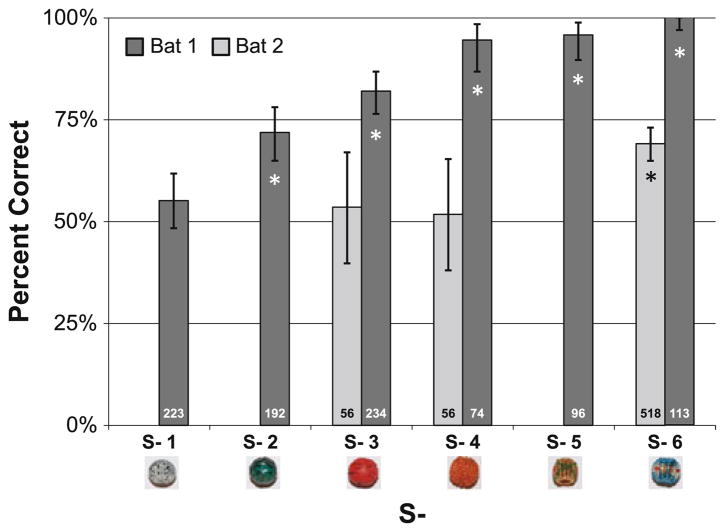
Fig. 2.
Bat performance with different S− objects. Confidence intervals calculated using a binomial distribution. The total number of trials for each S− is indicated at the base of each of the bars. Whether the bat’s performance is significantly different from chance for each S− is indicated with an asterisk (p <.05). Bat 1 was tested with all the S−, while Bat 2 was only tested with S− 3, 4 and 6

