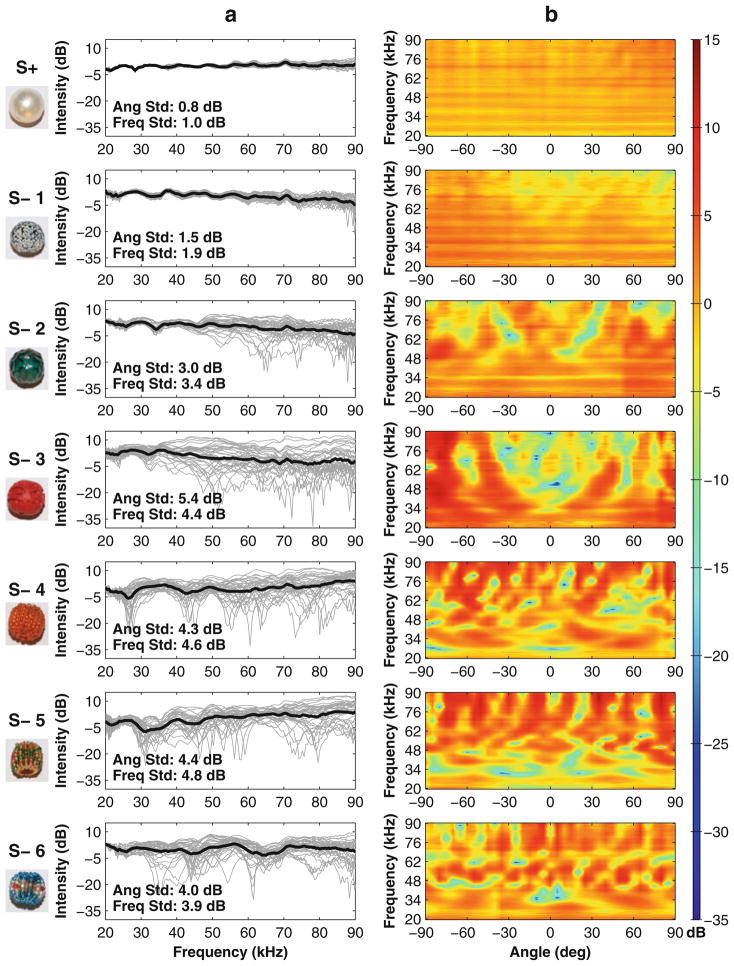
Fig. 3.
Transfer functions calculated from echo recordings taken from different angles of the different objects used in the study. Objects are presented from top to bottom in the same order that Bat 1 performed, from worst to best (S+ at the very top). a The calculated transfer functions at each angle (gray lines) and the mean transfer function across angles (black line) were plotted across frequency (x-axis) and intensity (y-axis). Echo transfer functions from each bead were normalized so that the mean value is positioned at 0 dB on the y-axis. The average change in intensity between angles is displayed on each panel as “Ang Std” and was quantified as the standard deviation in intensity at each frequency across angles (−90° to 90°, 5° increments) and averaged across frequencies (20–90, 0.5 kHz resolution). The average change in intensity in frequency (the amount of peaks and notches in the transfer functions) is displayed on each panel as “Freq Std” and was quantified as the standard deviation in intensity for each angle’s transfer function across frequency and averaged across angles. b The change in intensity across angles of the transfer functions is shown, with angle on the x-axis, frequency on the y-axis and intensity represented as color. This shows the effect of changing surface structure on each object’s transfer functions

