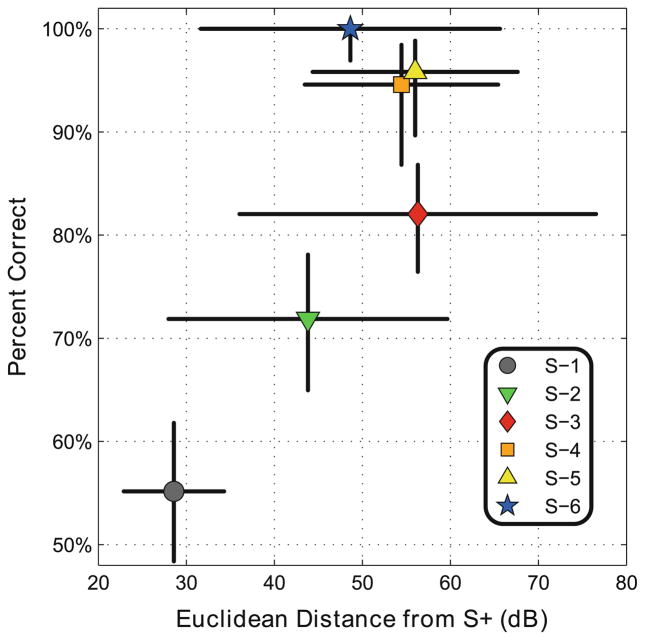
Fig. 4.
Euclidean distance metric between the angular-dependent transfer functions from each S− to S+ plotted against percent correct performance of Bat 1. The mean intensity of each transfer function was removed before computing this metric, as performance data indicated that the bat was not using overall intensity as a cue for discrimination. Error bars indicate the standard deviation for both the Euclidean distance metric and percent correct performance

