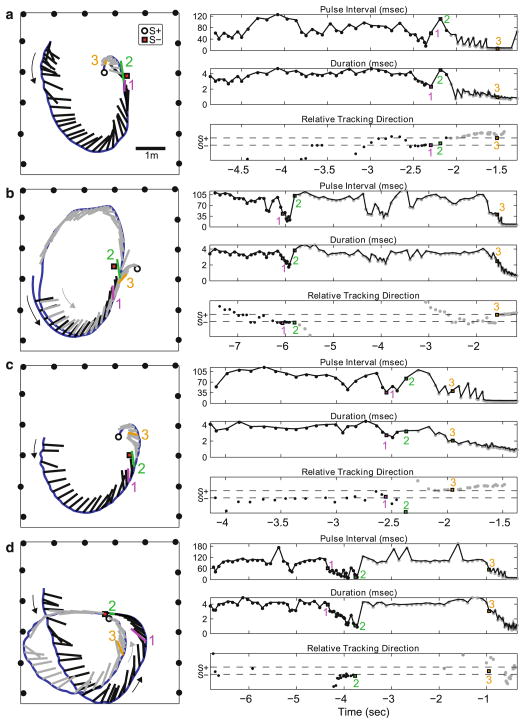
Fig. 5.
a–d Example behavior trials. Left panel top down view of flight room showing the bat’s flight trajectory (blue line) with vocalization beam directions (tick marks along flight trajectory, black before first pass, gray after first pass). The beam direction vectors were scaled in length to the inner window (minimum overlap zone, time between outgoing pulse duration and returning echo time). S+ labeled as white circle, S− labeled as red square. Microphones from the microphone array are indicated by black circles present on three sides of the room. Large curved arrows indicate the direction of bat’s flight path. Scale bar represents 1 m. Right top panel pulse interval (PI) of the bat’s vocalizations. Right middle panel duration of the bat’s vocalizations. Right bottom panel relative tracking direction of the bat’s sonar vocalizations. Relative tracking angle was defined as the difference between the measured tracking angle and the mean angle between the bat and the objects, divided by the mean difference angle between the bat and the objects. The resulting calculation returns −1 when the bat’s tracking angle is perfectly aligned with S− and +1 when tracking angle is aligned with S+. The y-axis numbering at −1 and 1 has been replaced with S− and S+. For right panel plots, x-axis time labeled according to each trial’s trigger time. Vocalizations numbered 1–3 were selected to highlight the bat’s beam-directing behavior at particular segments of the trial (see text)

