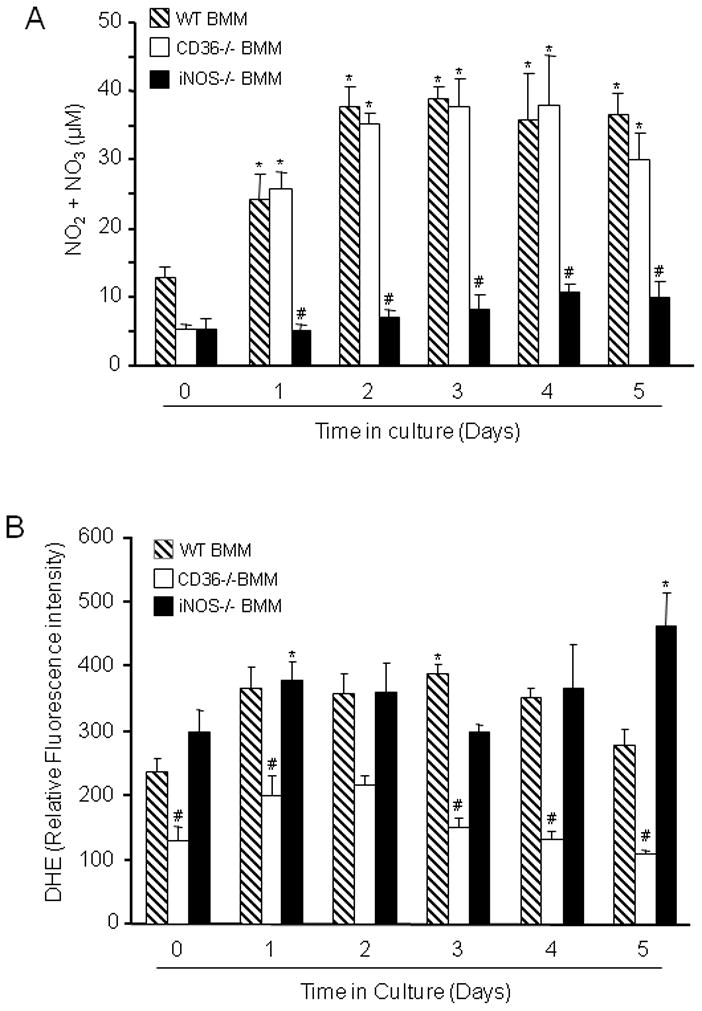
Figure 5.

Measurement of NO metabolites and ROS in LPS/IFN-γ activated WT, CD36−/− and iNOS−/− BMM. (A): Nitrite and nitrate concentration was measured in the culture medium by the Griess reaction. *p<0.05 from WT time 0; #p<0.001 from WT and CD36−/−; analysis of variance and Newman-Keuls test; n=8 from 4 sets of separate experiments. (B): ROS were measured in BMM suspensions using DHE as an indicator. ROS production is suppressed in CD36−/− BMM. *p<0.05 from WT time 0; #p<0.05 from WT and iNOS−/− BMM; analysis of variance and Newman-Keuls test; n=8 slices/group from 4 separate experiments.
