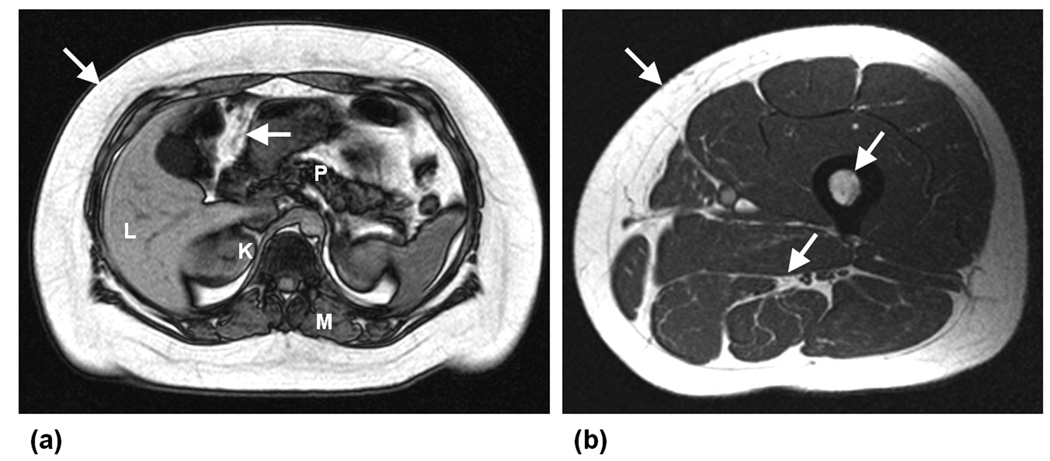
Figure 1.
Examples of T1-weighted axial MR images acquired in the (a) abdomen and (b) thigh, demonstrating the typical high signal intensities of fatty tissues (arrows) in contrast to other darker muscles and organs (L: liver, P: pancreas, K: kidneys, M: muscle). Data were acquired on a GE 1.5 Tesla scanner (Signa HD, 12M5).

