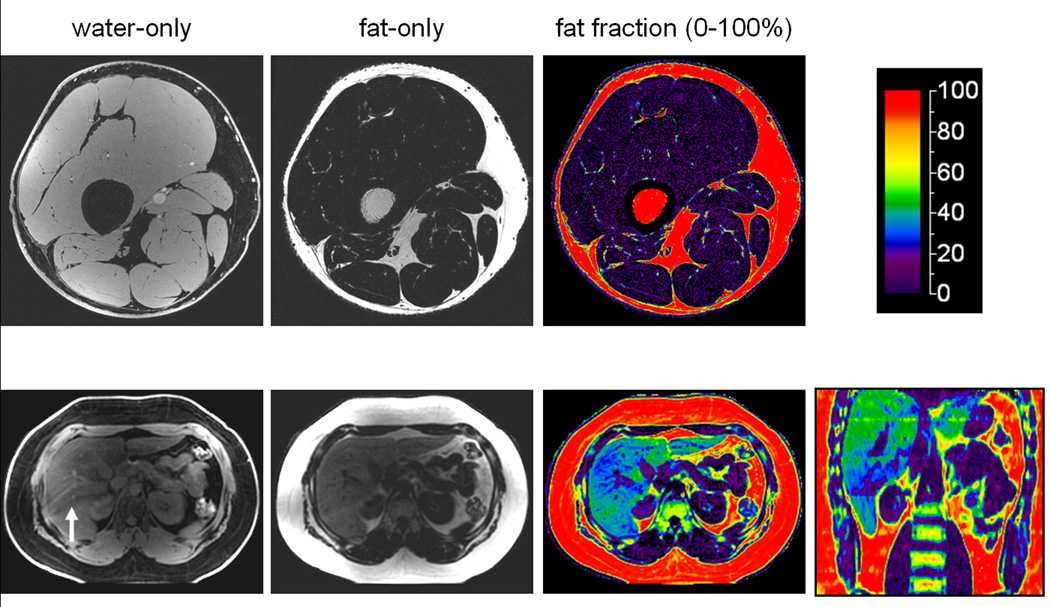
Figure 3.
Examples of 3 Tesla IDEAL. Reconstructed water-only, fat-only, and fat fraction images are illustrated for the thigh and upper abdomen. In the color fat fractions, the scale represents 0–100% percent fat content. In the thighs, note that subcutaneous and intramuscular adipose tissues and bone marrow are denoted by high (> 90% red) fat fractions. In the liver example, the color representation is indicative of very high 40% hepatic fat content. Coronal reformat illustrates the entire liver. The arrow in the water image denotes ripple-like artifacts from respiratory motion.

