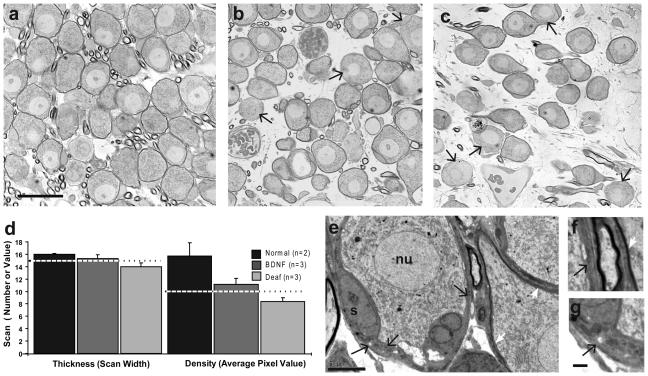
Figure 7.
Light micrographs of the SG neurons in 1 μm unstained sections (cut orthogonal to the radial plane) in a normal cat (a), in a cochlea studied after 10 weeks of BDNF treatment (b) and in the contralateral deaf ear of the same subject (c). Images like these from the 50-60% cochlear sector (~13 mm from the cochlear base) were used to perform pixel density scan measurements of SG somatic myelin and satellite cells. Data indicate a slight reduction in width and significant reduction in density in both BDNF-treated and contralateral deaf cochleae (d). The dashed line shows data for deafened animals studied at 30 days of age (n=3). Observations in TEM images (e,f,g) parallel the quantitative data, showing that some type I SG cells after BDNF treatment had perikarya that were unmyelinated or very thinly myelinated. In image e one SG neuron on the left is unmyelinated, surrounded by hypertrophied satellite cells (black arrows) that are often associated with such pathological neurons and another neuron on the right has fairly normal myelin (white arrows). Images in f and g show higher magnifications of two regions of the satellite cell indicated by the black arrows in e and adjacent myelinated cell (white arrow in f). nu, SG cell nucleus; s, satellite cell. (Scale bar in a applies to a-c and = 25 μm; scale bar in e = 5 μm; scale bar in g applies to f,g = 1μm)

