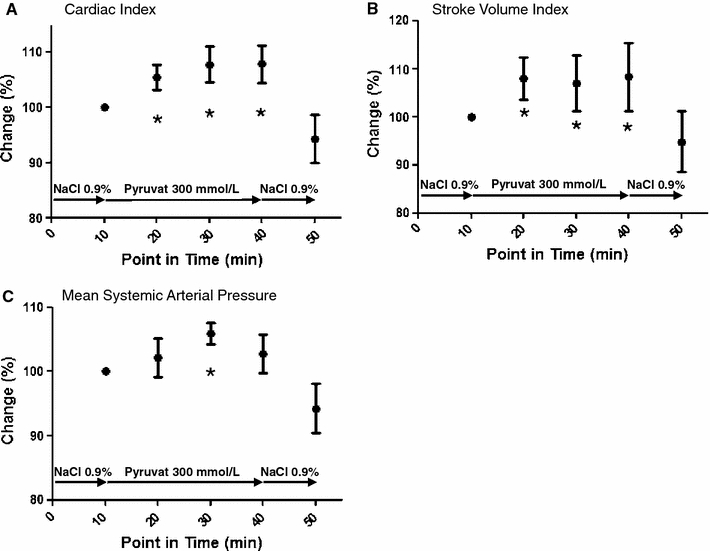
Fig. 1.

Graphs showing changes in CI (a), SVI (b), and mean SAP (c) under the influence of NaCl 0.9% and pyruvate 300 mmol/L at different points in time. Interventions are indicated by arrows. There was a significant effect of pyruvate on each hemodynamic parameter as calculated by repeated measures ANOVA. *Means p < 0.05 versus 50 min. Neither of all parameters showed significant differences at 50 min as compared to 10 min indicating stable hemodynamics at baseline
