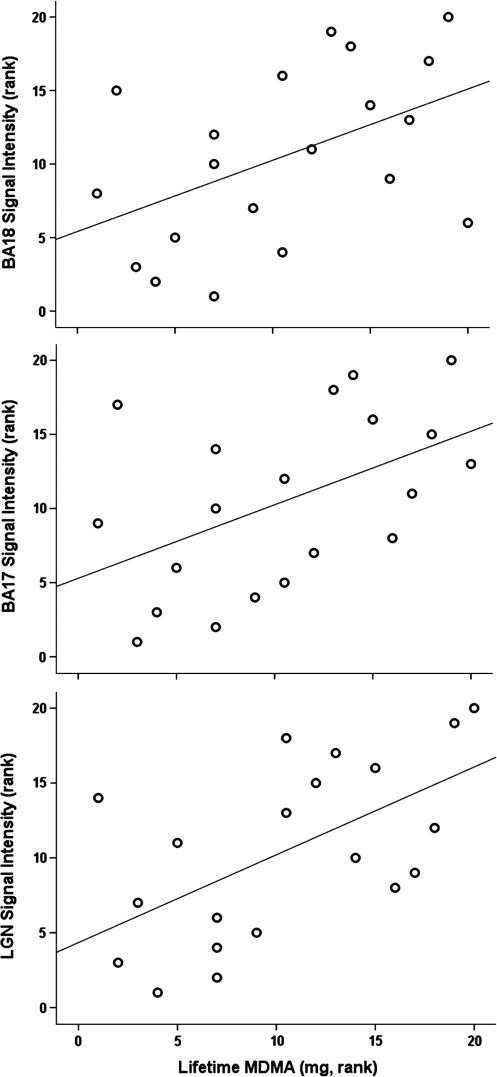
Figure 3.
Relationship of lifetime 3,4-methylenedioxymethamphetamine (MDMA) use to signal intensity in lateral geniculate nucleus (LGN), Brodmann Area (BA) 17, and BA 18. Y axis is the rank of signal intensity for the ROI (calculated as mean percent BOLD signal increase for high-intensity stimuli in right and left hemisphere). X axis is the rank of self-reported lifetime MDMA use in mg. Data shown for MDMA users only, N=20.

