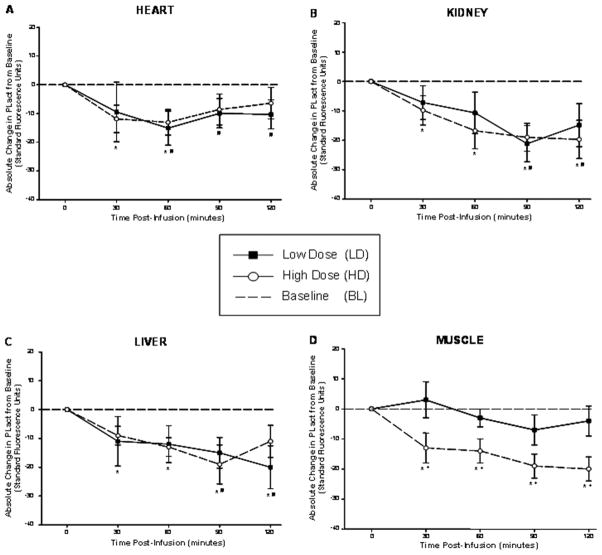
Figure 1.
(A) The computed absolute change in PLact in the heart compared to baseline, reflective of changes in PLact, following low/high dose aprotinin infusions demonstrates a nadir in PLact at 60 minutes post infusion for both low and high dose groups. (B) The computed absolute change in PLact in the kidney compared to baseline, reflective of changes in PLact, following low/high dose aprotinin infusions. Significant reductions in PLact occurred for all time points post infusion for the high dose group and at 90 and 120 minutes for the low dose group. (C) The computed absolute change in PLact in the liver compared to baseline, reflective of changes in PLact, following low/high dose aprotinin infusions. Significant decreases in PLact occurred for all time points post infusion for the high dose group and at 90 and 120 minutes for the low dose group. (D) The computed absolute change in PLact in the shoulder compared to baseline, reflective of changes in PLact, following low/high dose aprotinin infusions. Significant attenuation in PLact occurred for all time points post infusion for the high dose group only with significant differences in between high verses low dose responses for all time points (plotted values are mean±SEM, * p < 0.05 high dose verses baseline; + p < 0.05 high dose verses low dose).

