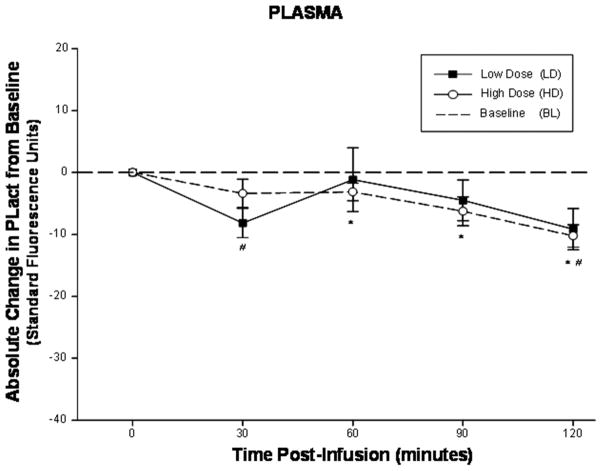
Figure 2.
The computed absolute change in plasma PLact compared to baseline, reflective of changes in PLact, following low/high dose aprotinin infusions. Plasma PLact initially declined at 30 minutes, followed by a relative transient rise and subsequent progressive decrease with significant inhibition in PLact at 120 minutes post infusion for both the low and high dose groups (plotted values are mean±SEM, # p < 0.05 low dose verses baseline; * p < 0.05 high dose verses baseline).

