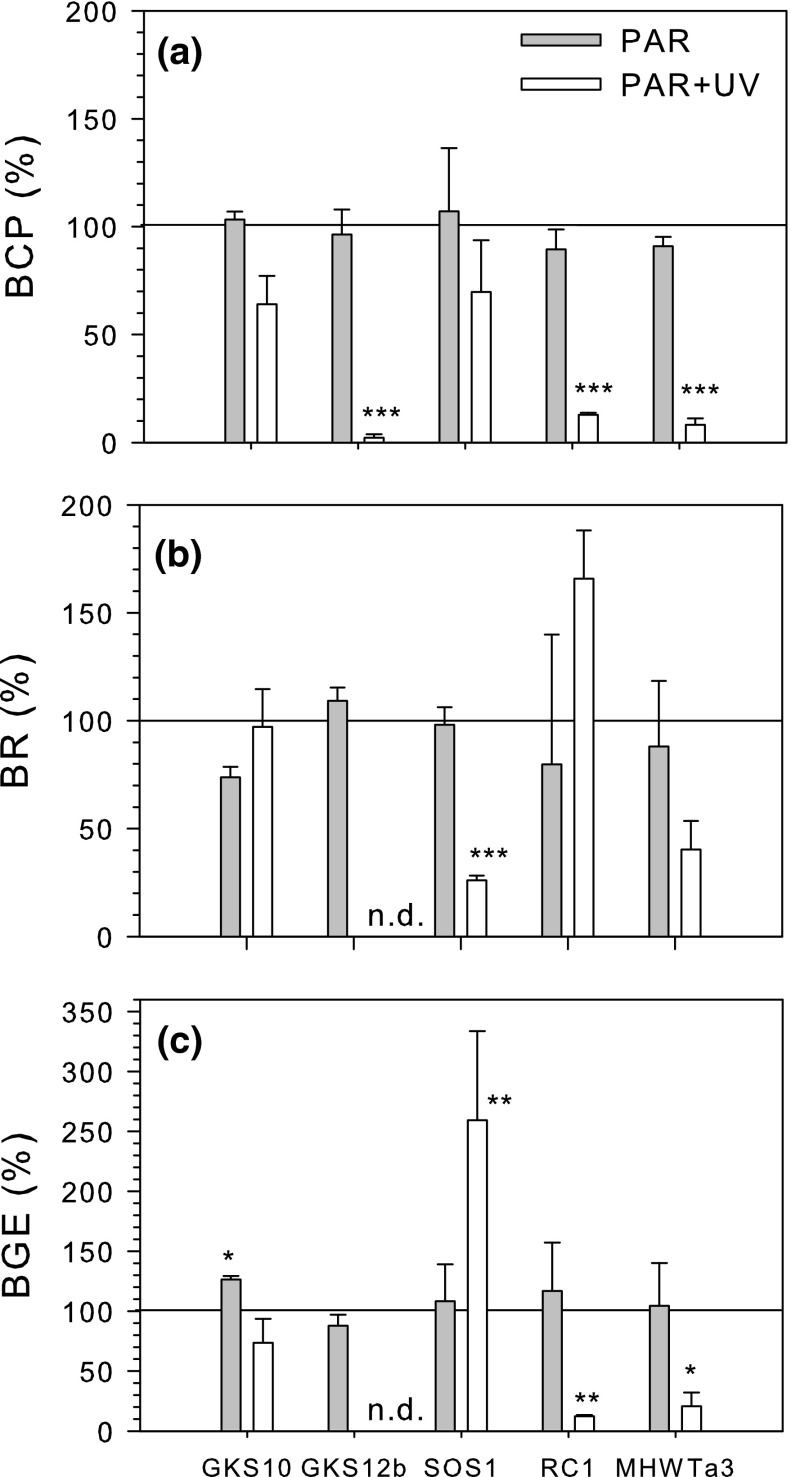
Fig. 4.
a Cell-specific bacterial carbon production (BCP), b cell-specific bacterial respiration (BR), and c bacterial growth efficiency (BGE) of strains GKS10, GKS12b, SOS1, RC1, and MHWTa3 after exposure to photosynthetically active radiation (PAR) and PAR + UVR. Mean values (n = 3) are expressed as percentage of the DARK control (horizontal line reference) ±1 SD. The asterisks above the bar summarize the outcome of the post hoc Holm-Sidak test and indicate a significant difference between the DARK control and the respective treatment. Significance level: * P < 0.05, ** P < 0.01, and *** P < 0.001. nd not detectable

