
Figure 2.
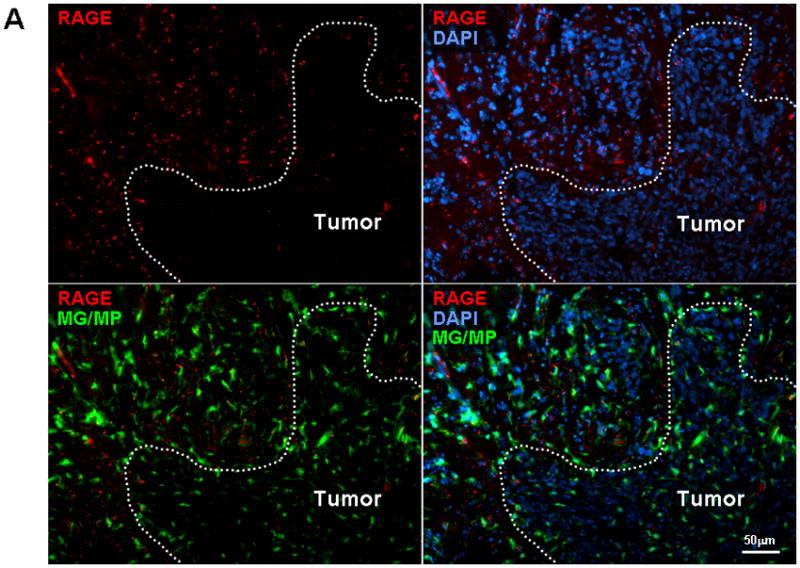
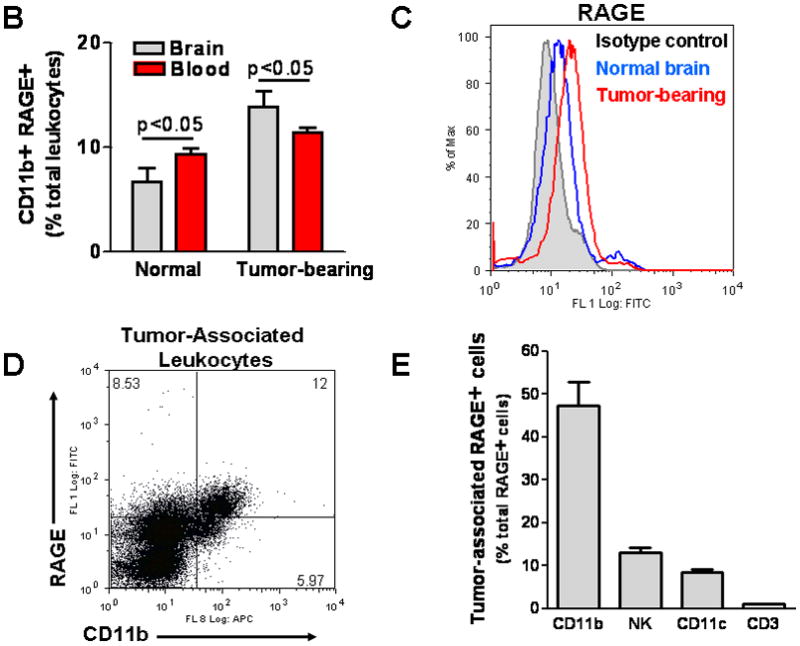
RAGE expression in intracranial gliomas. (A) Two weeks after GL261 implantation into CX3CR1GFP mice, brains were examined for RAGE expression by immunostaining. Most of the RAGE (red) was detected at the tumor periphery where microglia (MG) and macrophages (MP) were localized. (B) Flow cytometry analysis of leukocytes from blood and brains of normal and GL261-bearing mice demonstrating higher frequency of RAGE-expressing CD11b cells in tumor-bearing mice. (C) Histogram of brain tissue demonstrating upregulation of RAGE in Percoll-purified inflammatory cells associated with GL261 tumors. (D) Most of the tumor-associated CD11b+ cells expressed RAGE, and (E) MG/MPs (CD11b+) accounted for nearly half of RAGE+ cells in intracranial tumors. Experimental results are representative of two separate experiments. (n=3 mice/group, ±SEM)