
Figure 3.
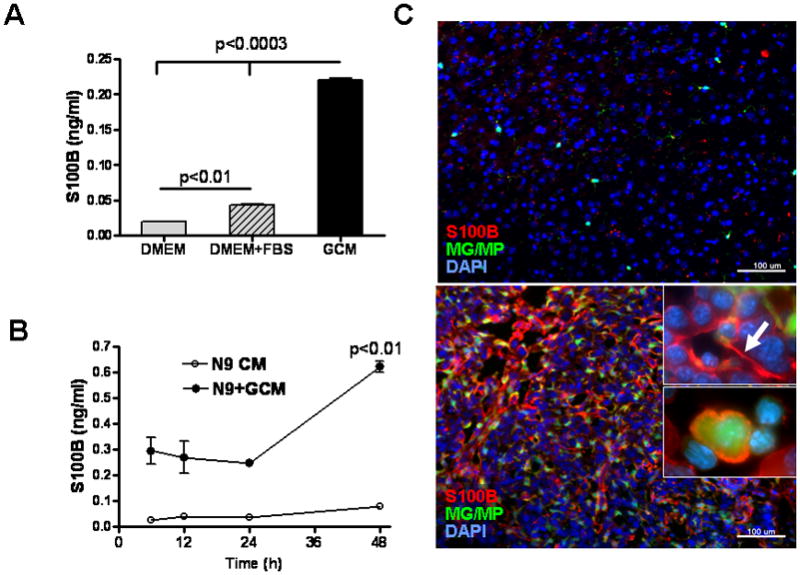
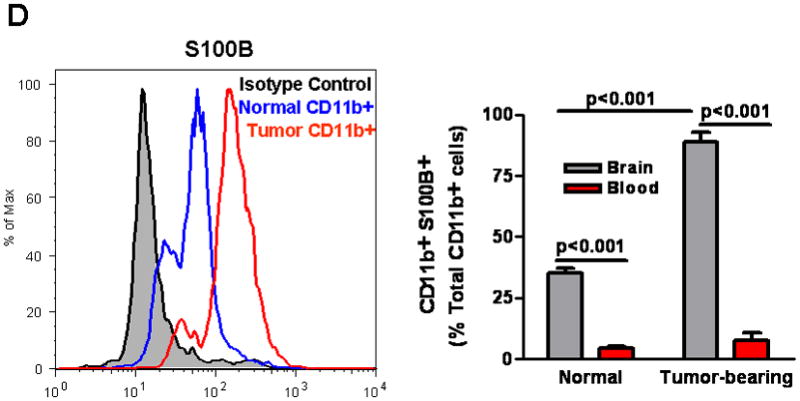
S100B production by GL261 gliomas. (A) S100B levels were measured in glioma-conditioned medium (GCM), DMEM and DMEM+FBS by ELISA. (B) S100B secretion by N9 cells (N9 CM) significantly increased at 48 hr when these cells were incubated with GCM (N9+GCM). (C) Immunostaining demonstrating S100B expression in intracranial GL261 gliomas. Two weeks after intracranial tumor implantation into CX3CR1GFP mice, brains were examined for S100B. Although little S100B was detected in normal brains (top panel), S100B staining (red, bottom panel) appeared both intracellularly and in the extracellular space (top inset, arrow) of tumors. A significant number of tumor-infiltrating microglia and macrophages (MG/MP, green cells) were also S100B-positive (bottom inset). (D) Flow cytometry analysis of S100B+ cells in normal and GL261-bearing mice. Left: Histogram of Percoll-purified brain tissue demonstrating upregulation of S100B by CD11b+ cells in tumors. Right: While only a small fraction of circulating blood CD11b+ cells in normal and glioma-bearing mice expressed S100B, nearly 90% of CD11b+ cells were S100B in GL261 tumors that were propagated in wt mice. Experimental results are representative of two separate experiments. (n=3 samples or mice/group, ±SEM)