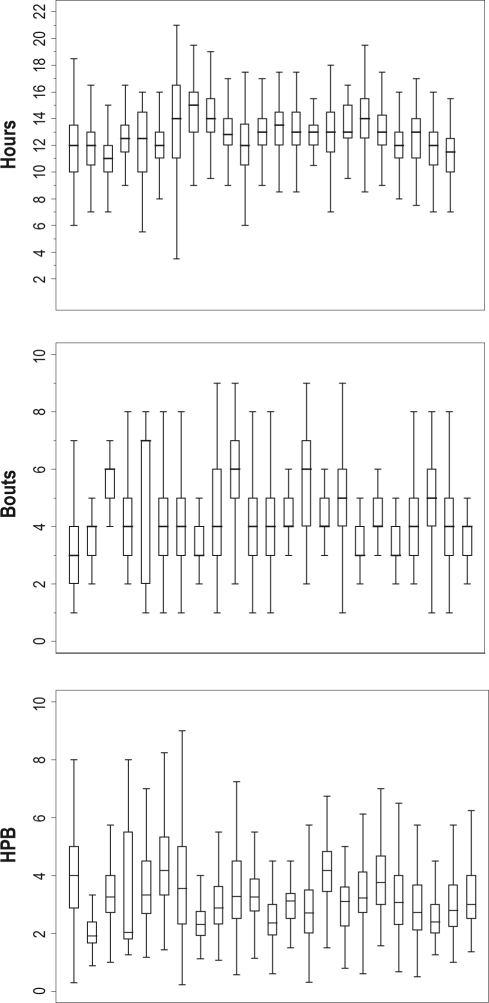
Figure 1.
Subject-specific sleep with total daily hours (top panel), number of daily bouts (middle panel), and hours per bout (HPB, lower panel). Box plots represent each individual's data. Central lines are the medians, and the whiskers are the upper and lower adjacent values [ ± 1.5 × IQR] for each individual subject (STATA 1129). Inter-individual differences in medians for hours, bouts, and HBP were significant (P < 0.001).

