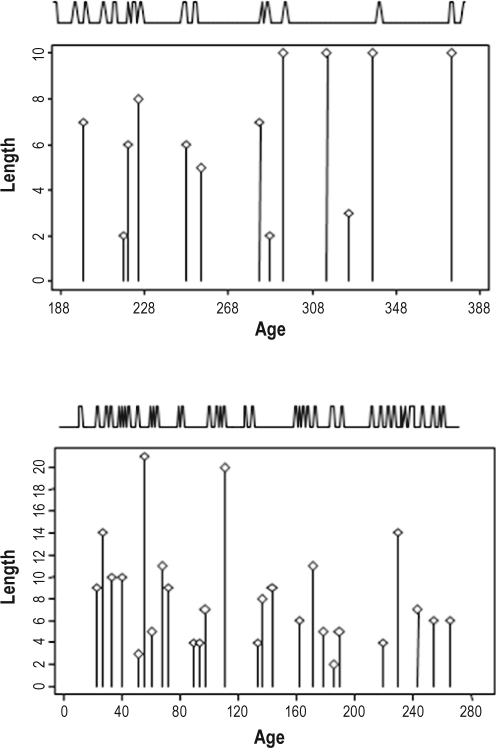
Figure 4.
Concordance between peaks in total daily sleep hours and saltatory length growth for a female (top panel) and male (bottom panel) infant measured twice weekly (alternating 3- and 4-day intervals). The locations of the sleep hour peaks (illustrated by the spikes across the top of the graphs) were identified by the CLUSTER algorithm31 and the length saltations (the body of the graphs) by the saltatory algorithm.17 The female (top panel) experienced 14 peaks in daily sleep hours and 13 length saltations; 11 of the 13 length saltations were concordant with sleep peaks. This has a probability of less than 1.8 × 10⁻⁶ of occuring by random chance. The male experienced 38 sleep peaks and 26 length saltations; 20 of the 26 length saltations were coincident with sleep. This has a probability of less than 3.2 × 10⁻⁵ of occuring by random chance.

