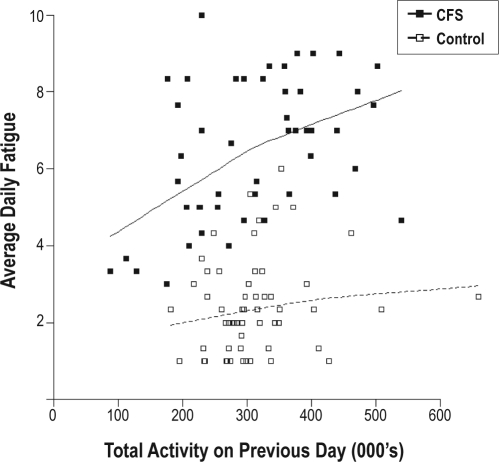
Figure 3.
Preceding day total activity and daily fatigue. The boxes on the graph are individual data points (see legend). The unbroken line represents the overall relationship for CFS and broken line for controls. Total activity is in thousands of activity counts. Average daily fatigue refers to fatigue ratings on a 10-point scale.

