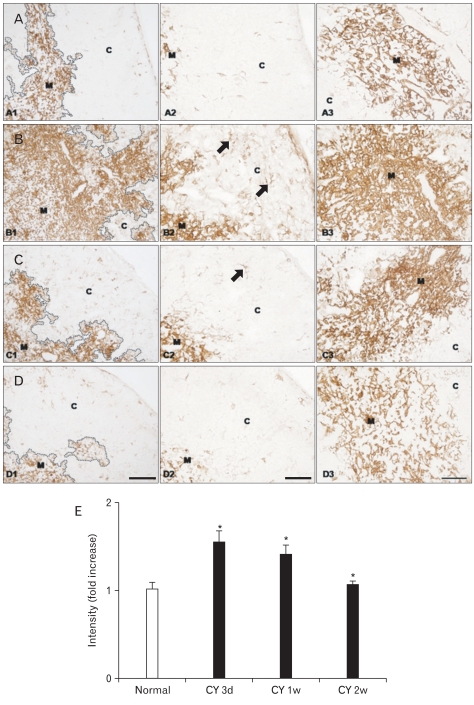
Fig. 2.
(A-D) Immunohistochemical localization of cytokeratin (CK)14 in frozen sections of mouse thymus from control animals (A1-3, n=4), and at 3 (B1-3, n=7), 7 (C1-3, n=6), and 14 (D1-3, n=4) days after cyclophosphamide treatment. C, cortex; M, medulla; arrows, CK14+ thymic cortical epithelial cells. Scale bars=100 µm (A1, B1, C1, D1), 50 µm (A2, A3, B2, B3, C2, C3, D2, D3). (E) Data on the relative intensity of CK14 expression in the thymic medulla are also plotted in a bar graph and expressed as mean±standard deviation. CY 3d, CY 1w, and CY 2w represent 3, 7, and 14 days after cyclophosphamide treatment, respectively. *P<0.001 compared with the control, as determined by the t-test.

