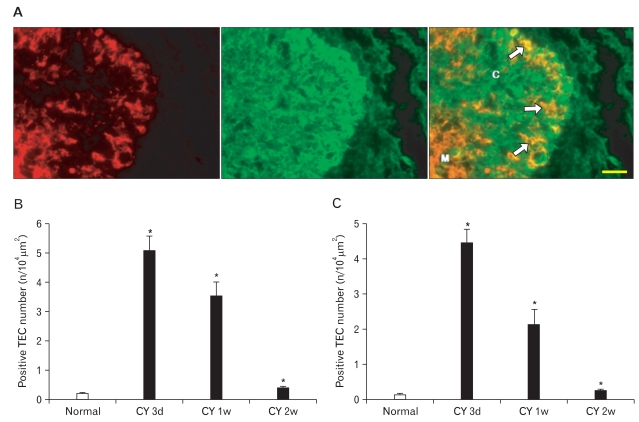
Fig. 5.
(A) Two-color double-label immunofluorescent localization of cytokeratin (CK)8 (green) and CK5 (red) in frozen sections of mouse thymus 3 days after cyclophosphamide treatment. C, cortex; M, medulla; arrows, CK5+CK8+ thymic epithelial cells. Scale bar=50 µm. Data on the relative number of CK5+CK8+ (B) and CK14+CK8+ (C) Cotical thymic epithelial cells (cTECs) are also plotted in a bar graph and expressed as mean±standard deviation. *P<0.001 compared with the control, as determined by the t-test.

