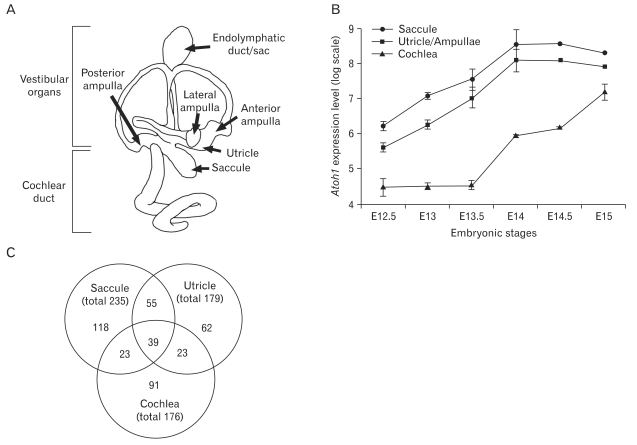
Fig. 1.
Atoh1 expression patterns during inner ear development and the numbers of genes expressed in a similar pattern with Atoh1. (A) Diagrammatic representation of the substructures of the mouse inner ear. (B) Expression levels of Atoh1 in the cochlea, saccule, and utricle/ampullae mixture from embryonic day 12.5 (E12.5) to E15 extracted from the dataset GSE7536 and plotted on a logarithmic scale. (C) The number of genes expressed in a similar pattern with Atoh1 in each organ analyzed from the dataset GSE7536 and the number of genes found in two or more organs.

