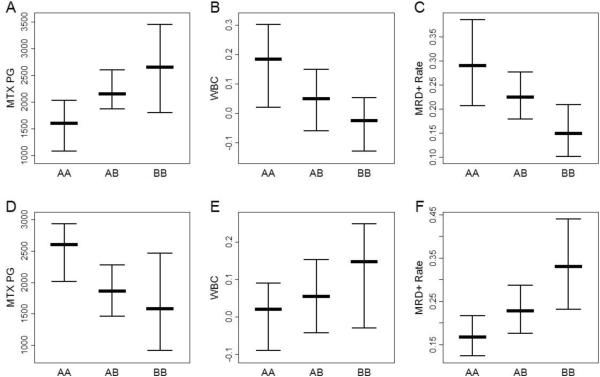
Figure 2.
Therapeutically beneficial and detrimental patterns of association. For a SNP with a therapeutically beneficial B allele, an increase number of B alleles is associated with an increase in MTX PG (panel A), a decrease in WBC (panel B), and a decrease in the MRD+ rate (panel C). For a SNP with a therapeutically detrimental B allele, an increase in the number of B alleles is associated with a decrease in MTX PG (panel D), an increase in WBC (panel E), and an increase in the MRD+ rate (panel F). Panels A, B, D, and E show the median MTX PG or median WBC with error bars defined by the sign-test based confidence interval for the median. Panels C and F show the proportion of subjects with detectable minimal residual disease (MRD) after 46 days of therapy with error bars defined by the confidence interval based on the binomial distribution. The confidence intervals in this figure are intended solely for visualization because they are not adjusted for therapy group. The confidence intervals are computed using the sign-test method and binomial distribution have been previously described [11].

