
Figure 1. Diagrammatic depiction of five patterns of massive hepatic necrosis (MHN).
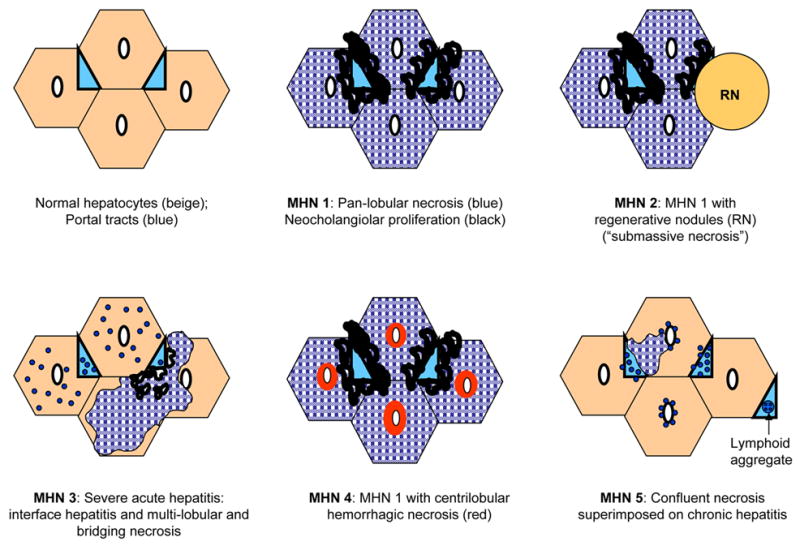
Normal hepatic architecture is depicted in the upper left diagram for comparison. Areas of hatched blue represent necrotic hepatocytes and areas in light blue represent portal tracts.