
Figure 1.
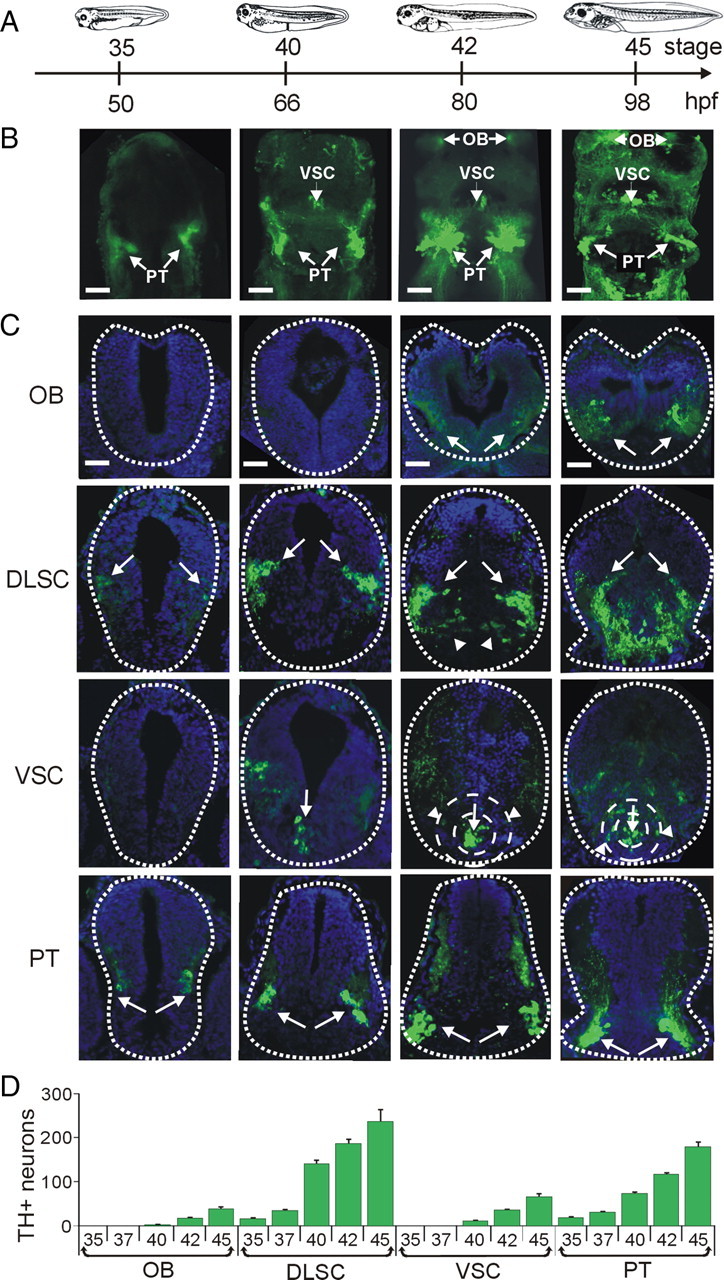
Development of brain dopaminergic nuclei. A, Developmental timeline showing stages and corresponding hours postfertilization (hpf) at which larvae were fixed for the images shown above. B, Whole-mount projections of brains stained for TH show caudal-to-rostral appearance of dopaminergic nuclei. Images are ventral side and rostral end up. The PT nucleus is visible from stage 35; by stage 40, the VSC can be detected; and by stage 42, the OB is also present. C, Cross sections through the brain were used for quantification of TH+ cells. TH staining is shown in green and DAPI staining of cell nuclei is shown in blue. Arrows point to TH+ cells in each section. The first row shows the OB, and the second row shows the DLSC. Arrowheads in this row point to a medial branch of the DLSC that becomes more prominent during development. The third row depicts the VSC. The arrows point to the core and the arrowheads point to TH+ cells in the annular region of the VSC, present from stage 42. The fourth row shows the PT nuclei. D, Quantification of the number of TH+ neurons per nucleus during development. Scale bars, 50 μm. Values are mean ± SEM for n ≥ 6 larvae per stage.