
Figure 4.
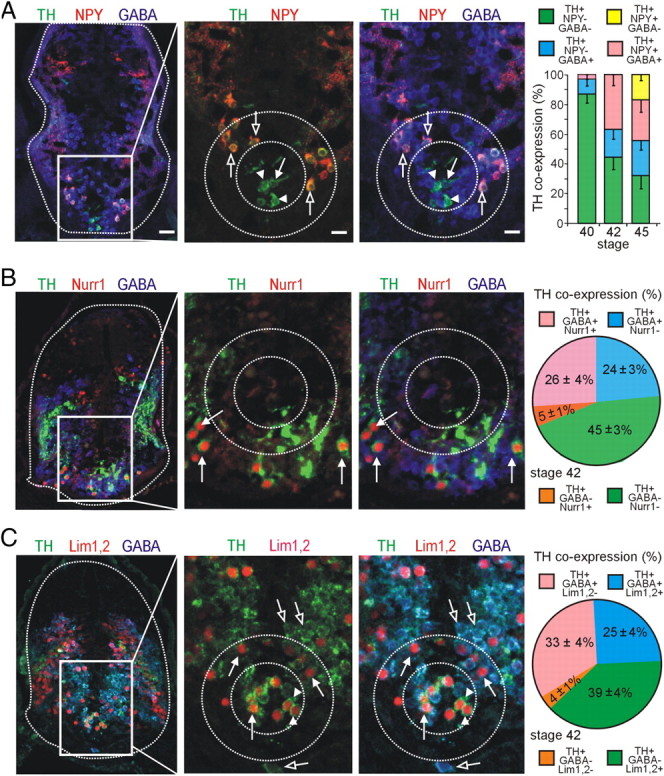
Coexpression of TH with other molecular markers during development of the VSC. GABA, NPY, or GABA/NPY are coexpressed in distinct regions of the VSC during development. A, Some TH+ cells in the core region (inner dashed circle) coexpress GABA (arrow), whereas others are GABA− (arrowheads). TH+ neurons in the annular region are TH+/GABA+/NPY+ (outer dashed circle, open arrows). Graph shows developmental changes in proportions of GABA and NPY coexpression with TH. B, TH+ cells of the outer annular region coexpress GABA and Nurr1 (arrows). This brain section depicts a more caudal region of the VSC. Graph shows the proportion of TH coexpression with GABA and Nurr1. C, TH+ cells of the core all coexpress Lim1,2 (arrowheads), but some are also GABA+ (arrows), whereas the TH+ cells in the annulus coexpress Lim1,2 and GABA (arrows). Cells in the outer annular region are Lim1,2− but coexpress TH and GABA (open arrows). Graph shows the proportion of TH coexpression with GABA and Lim1,2. A–C, Images are from stage 42 larvae. Scale bars (in A apply to all figures in each column): column 1, 80 μm; columns 2, 3, 40 μm. Values are mean ± SEM for n ≥ 4 larvae per stage.