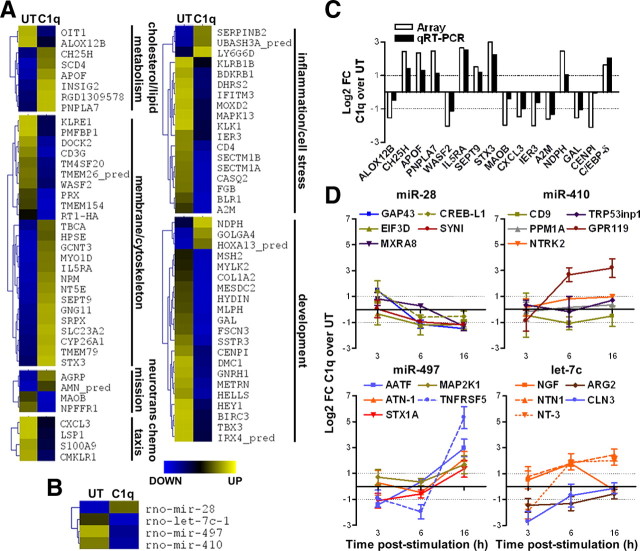
Figure 1.
Regulation of gene and miRNA expression by C1q in primary cortical neurons. A, B, Functional clustering of GO annotated genes (A) and miRNAs (B) significantly modulated by C1q compared with untreated (UT) neurons. Standardized means shown with a color gradient from blue (downregulated) to yellow (upregulated). C, Comparison of array and qRT-PCR data for 16 significantly modulated genes by C1q. The results are expressed as the means of log2 FC of C1q over untreated. D, Gene expression of miRNA predicted targets studied by qRT-PCR over a 16 h time course study. Results are expressed as the mean ± SD of log2 FC from triplicate samples from two independent experiments. Line color corresponds to the color-coded classifications in supplemental Figure 1 (available at www.jneurosci.org as supplemental material).

