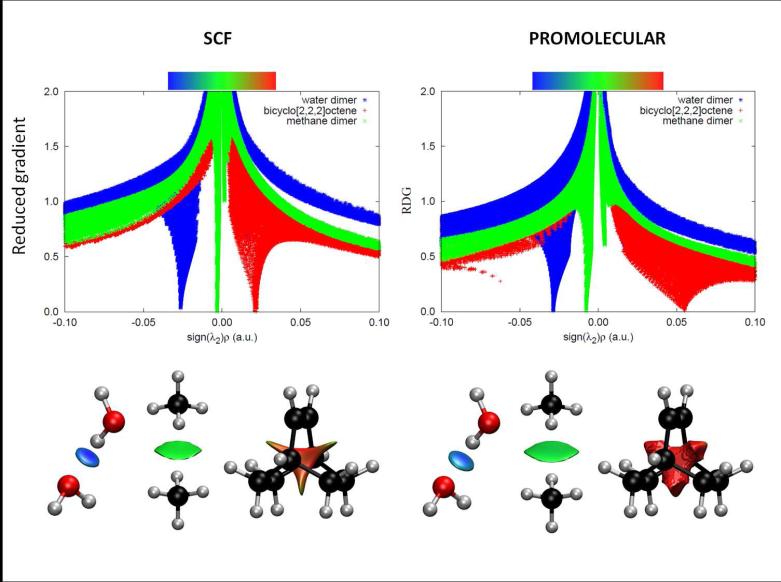
FIG. 2.
Top: Overlapping troughs in s(ρ) plots can be distinguished when sign(λ2)ρ is used as the ordinate. Favorable interactions appear on the left, unfavorable on the right, and van der Waals near zero. The same s(ρ) features are obtained using self-consistent (left) and promolecular (right) calculations, with a shift toward negative (stabilizing) regimes. Bottom: Taking the shift in troughs into account (i.e. changing the cutoff), the isosurface shapes remain qualitatively unaltered for selected small molecules. Figures are shown for both SCF (left) and promolecular densities (right). NCI surfaces correspond to s = 0.6 au and a colour scale of −0.03 < ρ < 0.03 au for SCF densities. For promolecular densities, s = 0.5 au (water and methane dimers) or s = 0.35 au (bicyclo[2,2,2]octene) and the colour scale is −0.04 < ρ < 0.04 au.

