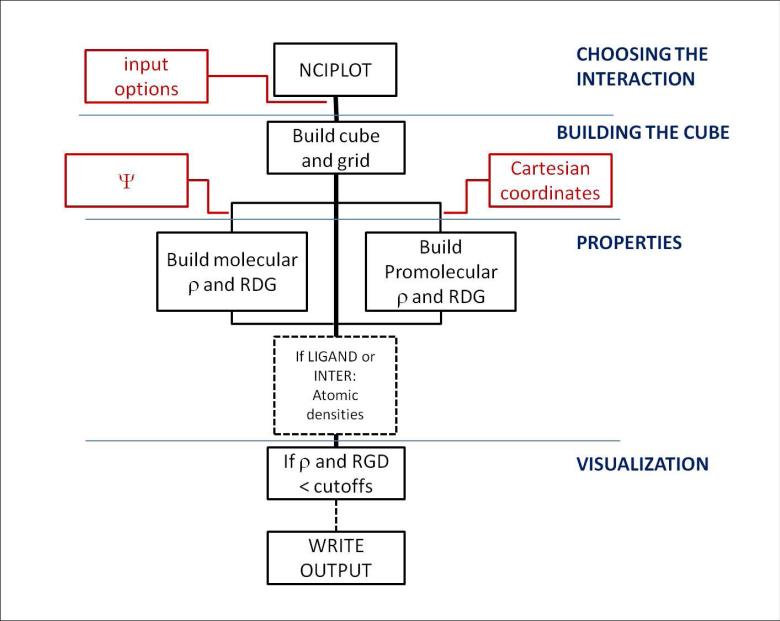
FIG. 3.
Flow chart for program routines for non-covalent interactions visualization in NCIPLOT. Red labels highlight the information that can be input by the user, whereas black labels show the internal flow of information. The flow is divided into four main algorithmic parts: input, cube construction, properties, and visualization.

