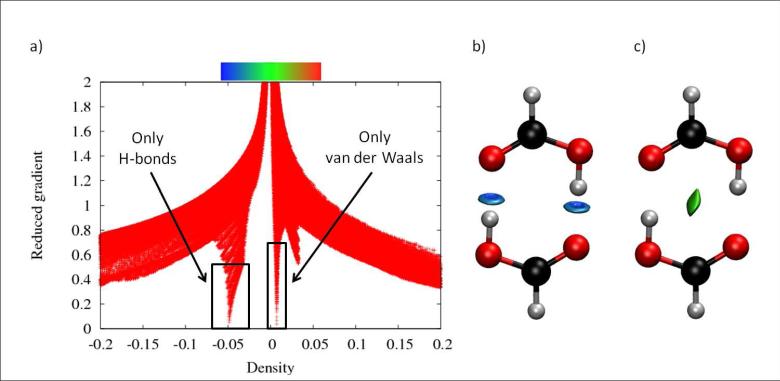
FIG. 4.
NCI analysis of formic acid dimer. a) s(ρ) plot for the SCF density. Peaks appear at ρ ≃0.01 au for vdW and ρ ≃0.05 au for hydrogen bonds. b) If the cutoffs are set at s = 0.7 au and ρ < 0.02 au, the isosurface only recovers the van der Waals interactions in the system. c) If the cutoffs are set at s = 0.5 au and 0.02 < ρ < 0.06 au, only the hydrogen bonds are displayed. The NCI colour scale is −0.06 < ρ < 0.06 au.

