
Figure 2.
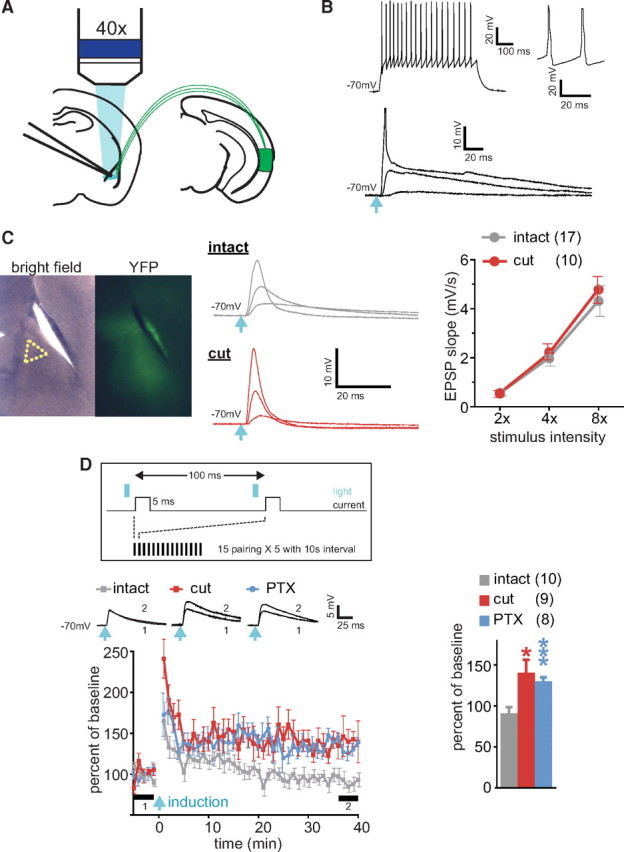
EC suppresses LTP in TeA–LA pathway. A, Experimental scheme for recording responses to optical stimulation of TeA axons in LA. B, Top, Response in a putative paracapsular interneuron to a 100 pA current step. Magnified time-scale spikes are shown on the right. Bottom, EPSPs evoked by blue light pulses (light blue arrow) with 2×, 4×, and 8× intensity of the threshold energy. Peak of action potential at 8× intensity is truncated. Light blue arrow indicates light pulse. C, Left, Bright-field/fluorescence (YFP) images of a slice with a cut separating EC from LA. Recording area is indicated by a yellow dot triangle. Middle, Examples of EPSPs evoked by blue light pulses with 2×, 4×, and 8× intensity of the threshold energy. Right, Input–output analysis of EPSPs. D, Top, LTP induction protocol. Left, LTP in TeA–LA pathway; insets represent averaged EPSPs before (1) and after (2) induction as indicated by thick bars (5 min each). Right, Summary for the LTP. *p < 0.05, ***p < 0.001. Error bars represent SEM. Number of cells is shown in parentheses.