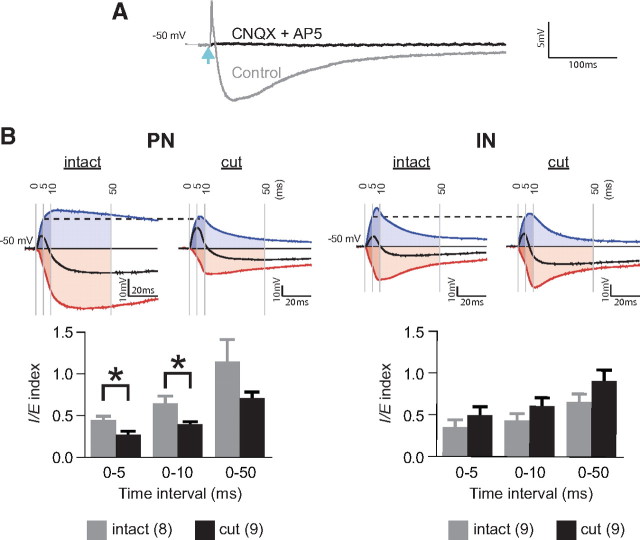
Figure 3.
Transection of EC shifts balance between inhibition and excitation in PNs toward excitation during activation of TeA fibers. A, EPSP/IPSP sequences evoked in PNs at −50 mV resting membrane potential (Control: gray trace) by blue light pulses (light blue arrow) with 4× intensity of the threshold energy are blocked by CNQX and AP-5 (CNQX+AP-5: black trace). Each trace is an average of five consecutive traces. B, Determination of I/E index for responses in PNs (left) and INs (right) from intact and transected slices. Top, Examples of mixed EPSP/IPSP response obtained in the absence of PTX (black line), excitatory response isolated in the presence of 100 μm PTX (blue line), and inhibitory component (red line) obtained by subtraction of the excitatory response from the mixed response. Shaded areas under the curves correspond to the time intervals of 5, 10, and 50 ms from EPSP onset. All responses are shown normalized to the EPSP amplitude at 5 ms (indicated by horizontal dashed line). Bottom, Summary diagram for the corresponding I/E indices. Number of cells is shown in parentheses. *p < 0.05. Error bars represent SEM.

