
Fig 8.
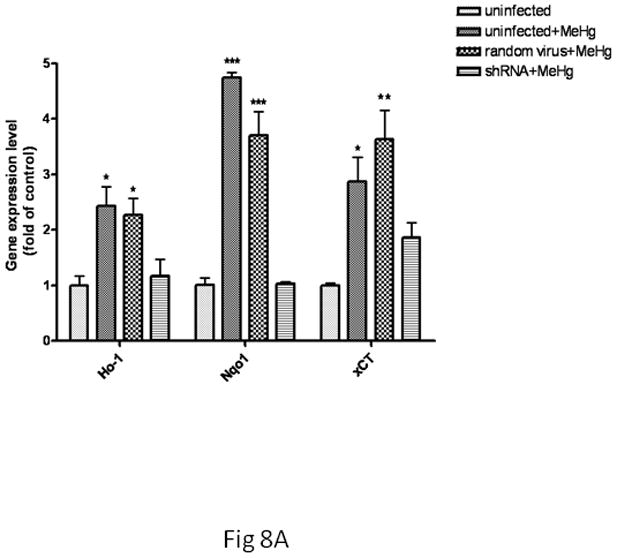
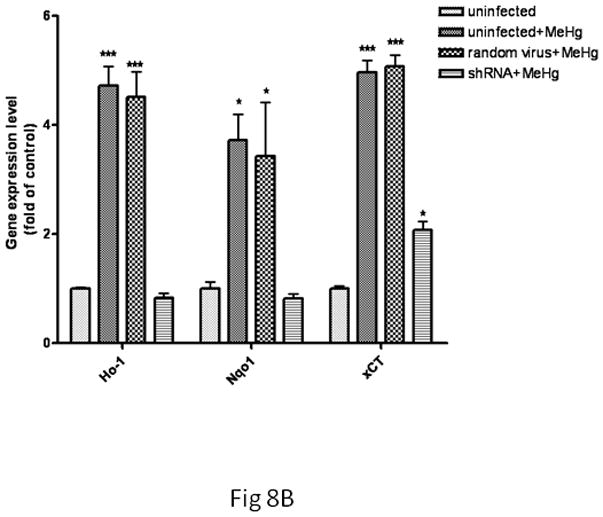
The effect of Nrf2 knockdown on Ho1, Nqo1 and xCT expression in MeHg-treated microglia and astrocytes. Both cell types were infected with lentivirus for 24 hr. Next, 5 μM MeHg was added for 30 min in microglia (A) and for 6 hr in astrocytes (B). Uninfected cells in the absence of MeHg treatment were used to measure the basal gene expression level. The mRNA levels of Ho1, Nqo1 and xCT were measured by real-time PCR. The difference in the average threshold cycle (ΔCt) value was determined and normalized to the expression of β-actin. Values are expressed as the mean ± SEM derived from three independent experiments. ★ P<0.05, ★ ★ P<0.01, ★ ★ ★ P<0.001