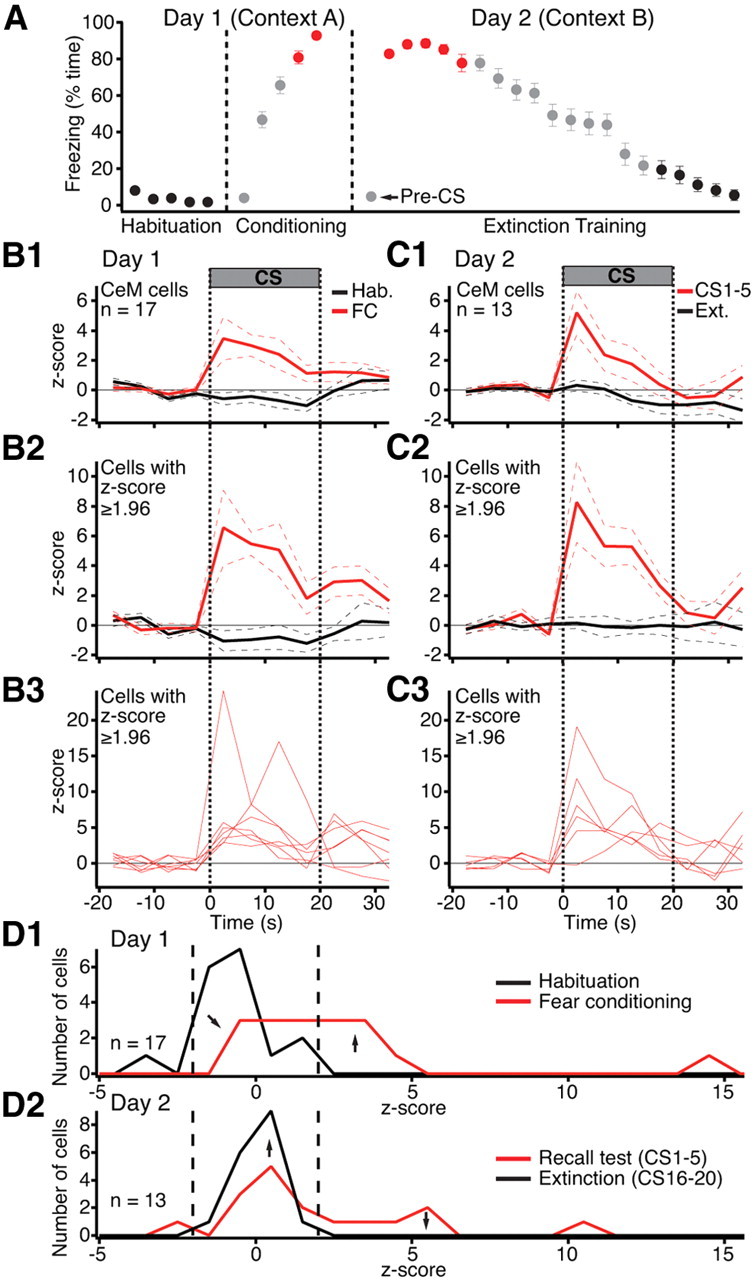
Figure 2.

The CS responsiveness of CeM neurons increases as a result of fear conditioning. A, Time (average ± SEM) rats (n = 33) spent freezing during the CS in various phases of the behavioral protocol (x-axis). Color-coded symbols indicate the CSs used to average the activity of CeM neurons in B–D. B, C, Peri-CS fluctuations in the firing rates of CeM neurons (5 s bins) on days 1 (B) and 2 (C). Average and ±SEM are shown by solid and dashed lines, respectively. 1, Average of all CeM cells. 2, Average of a subset of CeM cells with significant (p ≤ 0.05) increases in activity during the CS. 3, Activity of the cells used to obtain the averages of 2. D, Frequency distribution of z-scored changes in CS responsiveness on day 1 (D1) and day 2 (D2).
