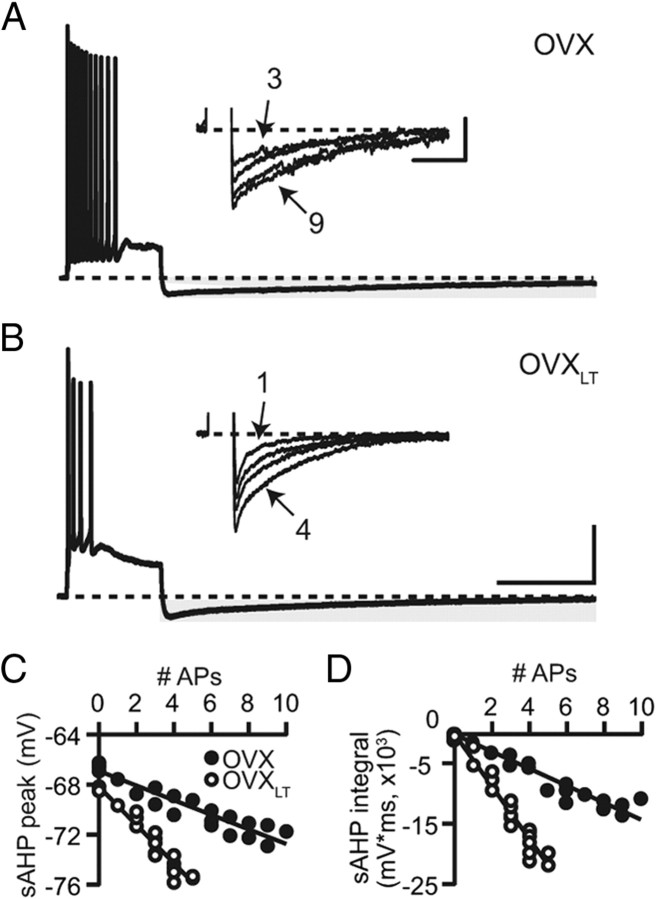
Figure 3.
The sAHP is enhanced in the OVXLT neurons. A, A representative voltage trace from a control OVX neuron, illustrating the sAHP (highlighted with gray shading) following a train of 11 APs. Dashed line indicates −65 mV. Inset, The sAHPs for the same neuron associated with 3, 5, 7, and 9 APs. APs were truncated. B, A representative voltage trace from an OVXLT neuron, illustrating the sAHP following a train of 4 APs. Inset, The sAHPs associated with 1–4 APs for the neuron shown in B. Calibration: full voltage traces, 25 mV, 1 s; inset, 4 mV, 2 s. C, D, The sAHPs for the neurons shown in A and B, measured either at the peak (C) or quantified as the total integral below −65 mV (D), were plotted as a function of the number of evoked APs. The sAHP–AP relations were fit with linear functions. On average, the y-intercepts for the sAHP peak–AP linear fit were not different between the control OVX and the OVXLT neurons (control OVX, −67.7 ± 0.6 mV; OVXLT, −67.4 ± 0.3 mV). The y-intercepts for the sAHP integral–AP fit for both groups were constrained to 0.

