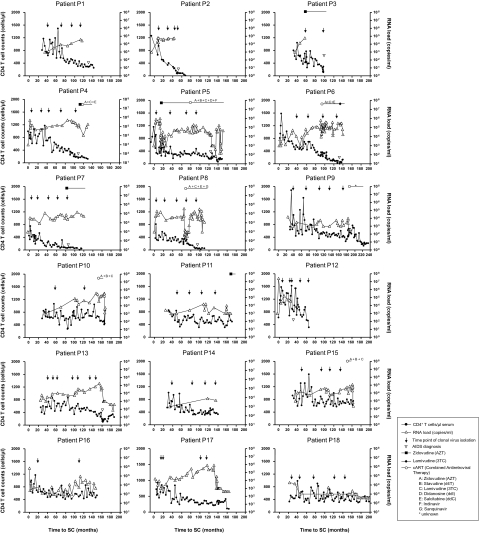
FIG. 1.
CD4+ T-cell numbers, viral loads, and antiretroviral treatments of 18 participants from the Amsterdam Cohort Studies who were selected for this study. Time points of clinical AIDS diagnosis are indicated with open downward triangles. Arrows indicate time points of clonal virus isolation. The length and type of antiretroviral therapy are indicated in the top part of the panels.

