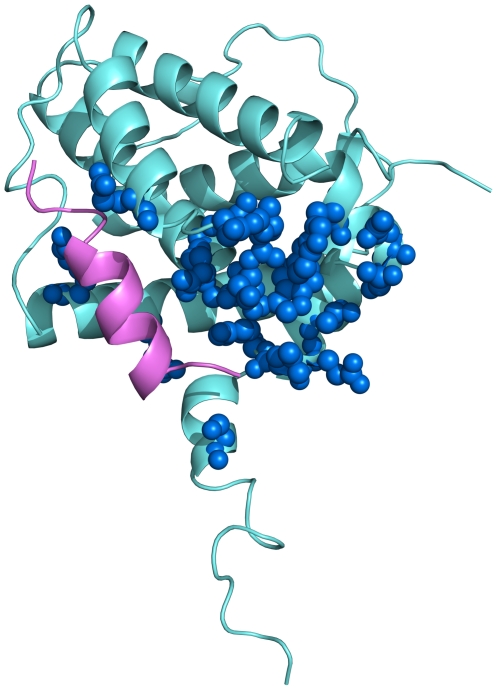
Figure 2. Bcl-xL interaction areas.
Ribbon representation of the structure of Bcl-xL: the putative transmembrane hydrophobic tail points towards the bottom part of the picture. Residues involved in contacts with cytochrome c are represented as blue spheres. The Bak peptide is shown in magenta and its interaction area has only a few contact points with that defined for cytochrome c.

