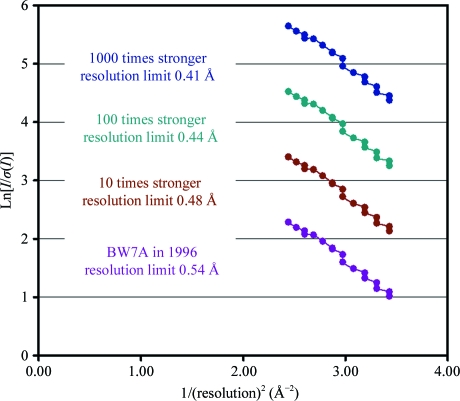
Figure 3.
Simulation of increased primary-beam intensity and extrapolation of the resolution limits for crambin from previous data collected on BW7A. The I/σ(I) ratio for the 16 bins within the resolution range 0.62–0.54 Å for the earlier data is shown in violet. The expected increase in this ratio at the PETRA1 beamline assuming a 1000-fold increase in intensity is shown in dark blue. A value of 1 on the vertical axis corresponds to I/σ(I) = 2.8, which was obtained for the outer shell in the earlier 0.54 Å data set. A linear extrapolation of the blue dependence gives a value of 1 at a resolution of just over 6 Å−2, which corresponds to about 0.4 Å.

