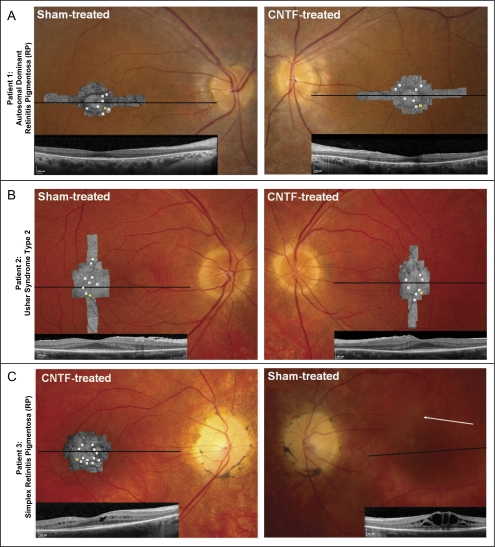
Figure 1.
Retinal and AOSLO images. For each patient, fundus photographs are shown with AOSLO images and foveal horizontal spectral-domain optical coherence tomography (OCT) scans superimposed (horizontal lines: OCT scan location; white squares on AOSLO images: ROIs where cone spacing was analyzed in each AOSLO image over 30 months; yellow squares: retinal locations of density examples shown in Fig. 2). (A) Sham-treated and CNTF-treated eyes of patient 1. (B) Sham-treated and CNTF-treated eyes of patient 2. Bilateral epiretinal membranes on OCT images. (C) CNTF-treated and sham-treated eyes of patient 3. No AOSLO images were acquired in the sham-treated eye of patient 3 because of severe cystoid macular edema and vitreous opacities (arrow points to opacity obscuring retinal detail).

