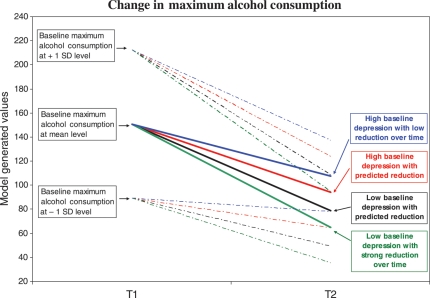
Fig. 3.
Model-generated plot of the baseline levels and changes in AUI Maximum alcohol consumption on any drinking day. Predictors of change were baseline level of maximum alcohol consumption, and levels and changes in SCL-90 Depression score. All factors were controlled for measurement errors. The figure shows the estimated changes at the baseline mean level and ±1 SD level.

