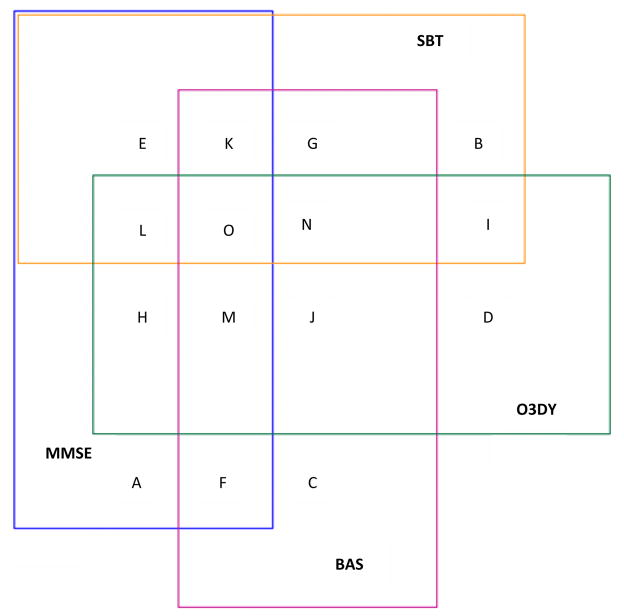
Figure 2. Venn Diagram for Abnormal Cognitive Screening Tests.
All subjects in this Venn diagram had abnormal cognitive screening test results. The overlapping regions of the rectangles represent agreement between the various instruments and are proportional to the actual results. The following key depicts the regions of agreement. The caregiver-taken Alzheimer’s Disease-8 (cAD8) was excluded from this analysis because not every subject had a cAD8 completed.
A = Mini Mental Status Exam (MMSE) only abnormal
B = Short Blessed Test (SBT) only abnormal
C = Brief Alzheimer’s Screen (BAS) only abnormal
D = Ottawa 3-Day-Year (O3DY) only abnormal
E = MMSE and SBT abnormal
F = MMSE and BAS abnormal
G = SBT and BAS abnormal
H = MMSE and O3DY abnormal
I = SBT and O3DY abnormal
J = O3DY and BAS abnormal
K = MMSE, SBT, and BAS abnormal
L = MMSE, O3DY, and SBT abnormal
M = MMSE, BAS, and O3DY abnormal
N = SBT, O3DY, and BAS abnormal
O = MMSE, SBT, BAS, and O3DY abnormal

