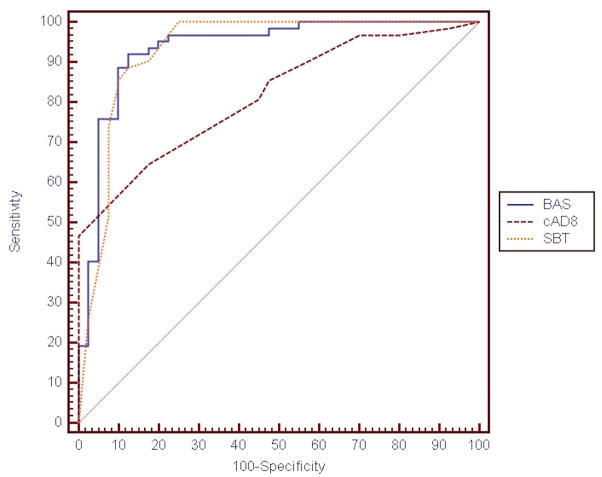
Figure 3.
ROC Curves for SBT, BAS, and cAD8*
| AUC (95% CI) | |
| BAS | 0.934 (0.867–0.974) |
| SBT | 0.930 (0.862–0.971) |
| cAD8 | 0.816 (0.727–0.886)† |
*N= 102 subjects who completed the MMSE, SBT, and BAS and had a caregiver present to complete the cAD8.
†cAD8 ROC AUC differs significantly from BAS (p = 0.01) and SBT (p = 0.008).
ROC = receiver operating characteristic; SBT = Short Blessed Test; BAS = Basic Alzheimer’s Screen; cAD8 = caregiver-completed Alzheimer’s Disease -8; AUC = area under the ROC curve

