Figure 3.
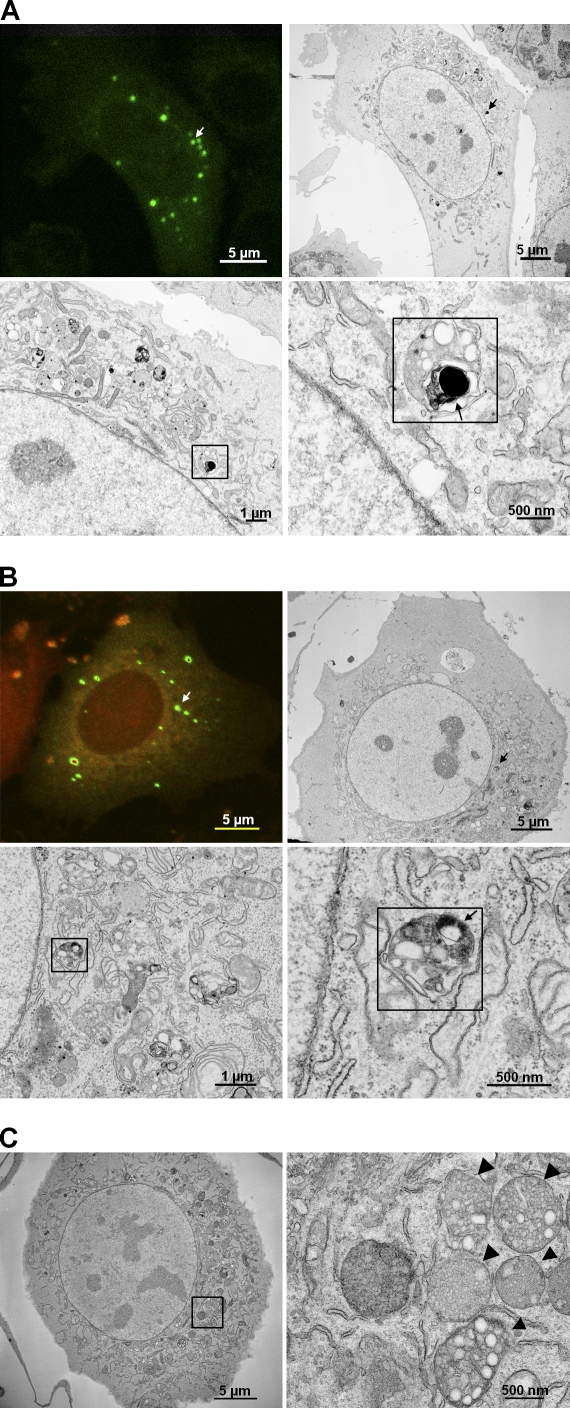
Ultrastructural analysis revealed localization of RIα-GFP in MVBs. Light and electron microscopy pictures were correlated to look for the localization of GFP-tagged RIα. (A and B, top) White/black arrows point to an MVB that was correlated. (bottom) The MVB is indicated by black squares. (bottom right) RIα-GFP is the dark black area within the MVB indicated by a black arrow. (A) Prkar1a−/− MEFs were transfected with RIα-GFP (green). (B) Prkar1a−/− MEFs were cotransfected with RIα-GFP (green) and PKAc-mCherry (red) and treated with 20 µM forskolin/200 µM IBMX. (C) Untransfected Prkar1a−/− MEFs were treated with 20 µM forskolin/200 µM IBMX. An enlarged image of MVBs from within the black square is shown on the right. The MVBs are indicated by black arrowheads.

