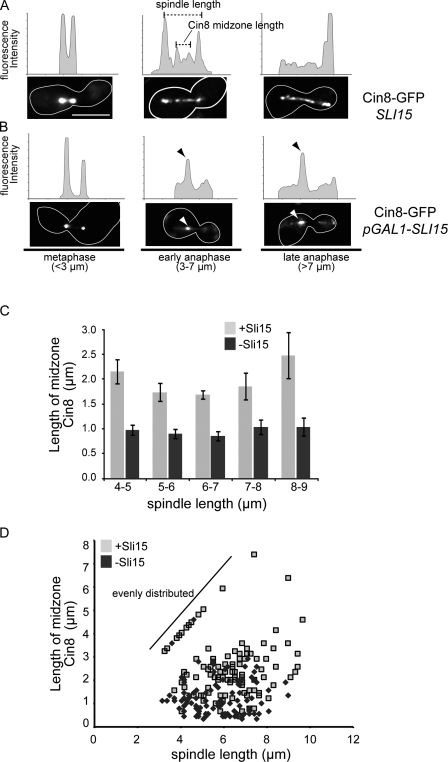
Figure 3.
Cin8-GFP is concentrated at the spindle midzone after depletion of Sli15. (A and B) Cells expressing Cin8-GFP in the presence (A) or absence (B) of Sli15 were filmed as in Fig. 1, and representative examples of mitotic spindles <3 µm, between 3 and 7 µm, and >7 µm are presented. Line traces show relative fluorescent intensities and are not comparable between cells. The dashed lines indicate how spindle length and Cin8 midzone length were measured for C and D. Arrowheads (black/white) in B indicate the concentration of Cin8-GFP at the spindle midzone and the corresponding fluorescent peak in the line trace. The white outlines indicate the cell border as determined in separate images (not depicted) based on autofluorescence. (C) The lengths of Cin8-GFP midzones were measured as shown in A and plotted for the indicated range of spindle lengths in the presence or absence of Sli15. Error bars represent standard deviations from the mean. (D) A scatter plot compares the length of Cin8-GFP spindle staining to the length of the spindle (CFP-Tub1) in the presence or absence of Sli15. The diagonal line indicates a population of mostly wild-type cells with contiguous Cin8-GFP spindle distribution (i.e., Cin8-GFP midzone length = spindle length). Bar, 5 µm.

