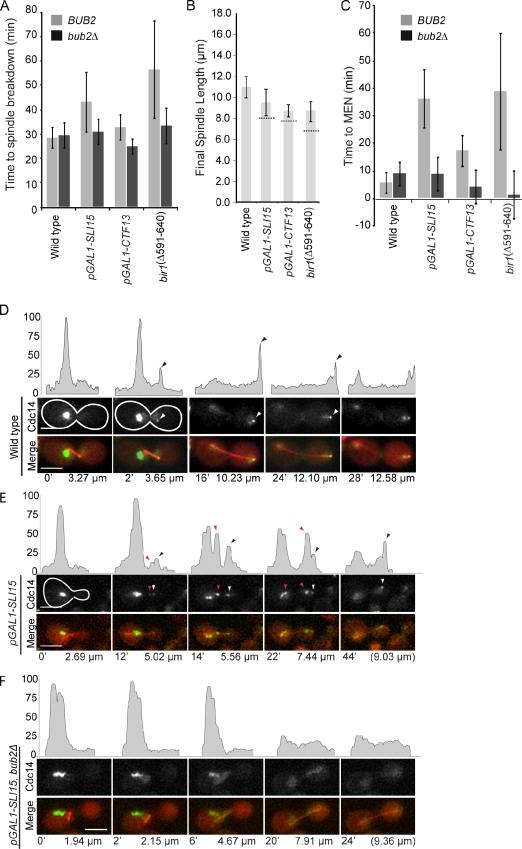
Figure 4.
CPC mutants delay Cdc14 release and prolong anaphase. The indicated CPC mutants, with or without BUB2, expressing CFP-Tub1 and Cdc14-GFP were filmed in anaphase. (A) The time to spindle breakdown was measured from the first frame of spindle elongation to spindle collapse. (B) The final spindle length reached before spindle breakdown is shown for each indicated strain. The dashed lines across the bar for the mutants indicate the projected spindle length, taking into account the slower rate of elongation and wild-type anaphase duration. (C) Time to mitotic exit was determined by monitoring the distribution of Cdc14-GFP. Full MEN activation was defined by the loss of fluorescence signal in the nucleolus. Error bars represent standard deviations from the mean. (D–F) Representative frames are shown from videos of wild type (D), pGAL1-SLI15 (E), or the double pGAL1-SLI15 bub2Δ (F) cells expressing CFP-Tub1 (red) and Cdc14-GFP (grayscale at the top and green in the merge). The time from the start of spindle elongation and the spindle lengths are indicated below the images. Line traces above the images show relative fluorescent intensities for Cdc14-GFP. Black arrowheads above the fluorescent intensity traces indicate Cdc14-GFP at the spindle pole (white arrowheads in the micrograph). The red arrowheads between spindle poles indicate Cdc14-GFP foci in pGAL1-SLI15 (E) but not the double pGAL1-SLI15 bub2Δ (F). The white outlines indicate the cell border as determined in separate images (not depicted) based on autofluorescence. Bars, 5 µm.

