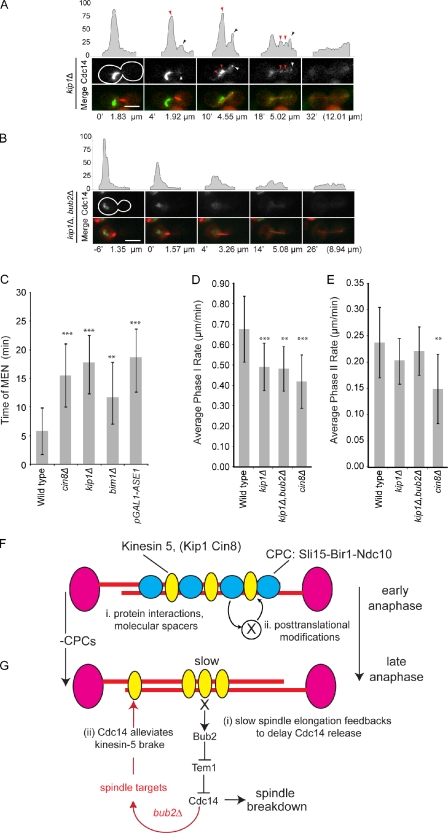
Figure 5.
MAP mutants that slow spindle elongation also delay Cdc14 release and prolong anaphase. (A and B) Representative frames and fluorescent intensity line traces from videos of kip1Δ (A) or kip1Δ bub2Δ (B) cells expressing CFP-Tub1 and Cdc14-GFP are presented as in Fig. 3 and Fig. 4. Arrowheads above the intensity profiles represent Cdc14-GFP at the daughter spindle pole (black on intensity profiles and white in the micrographs) or in foci between poles (red) in kip1Δ cells. The time from the start of spindle elongation and the spindle lengths are indicated below the images. The white outlines indicate the cell border as determined in separate images (not depicted) based on autofluorescence. (C) The mean time of MEN as measured by the complete release of Cdc14-GFP is plotted for indicated strains. (D and E) The corresponding values for spindle elongation rates are plotted. The statistical significance was determined by the comparison of mutants with wild type and is annotated here (also see Table II) as follows: **, P < 0.005; ***, P < 0.0005. (F) The model illustrates how CPCs might act to either (i) directly or (ii) indirectly distribute spindle midzone proteins. (G) The model summarizes feedback between spindle elongation and mitotic exit. (i) Release of Cdc14 is delayed when spindle elongation is delayed, a response that requires Bub2. (ii) The eventual release of Cdc14 during the transition from early to late anaphase or in bub2Δ alters spindle organization to alleviate the brake. Error bars represent standard deviations from the mean. Bars, 5 µm.

