Figure 2.
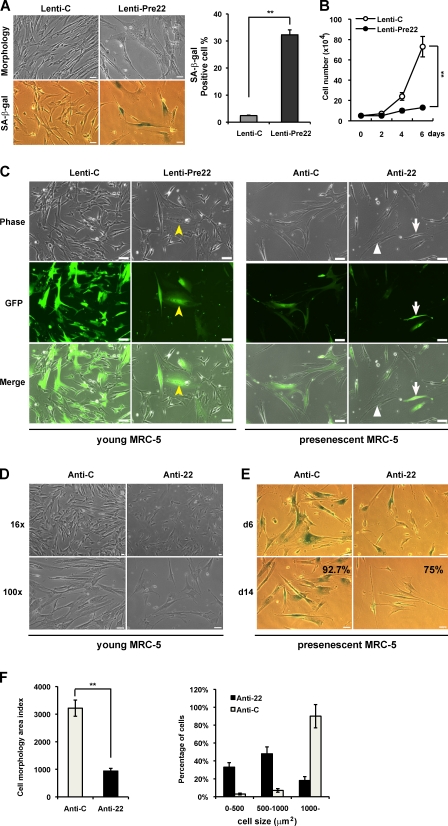
Stable expression and knockdown of miR-22 affect senescence phenotypes in MRC-5 cells. (A) Cell morphology and SA-β-gal activity were analyzed by phase-contrast microscopy at day 6 after infection with empty vector (Lenti-C) or premiR-22 (Lenti-Pre22). The percentage of SA-β-gal–positive cells is presented in the right histogram. (B) Cell proliferation assay was performed after infection of Lenti-Pre22, and cells were counted for the indicated days, compared with control cells. Each value was determined in triplicate. **, P < 0.01. (C) Cell morphology was analyzed with fluorescence microscopy at day 6 after infection. GFP-labeled cells indicate infected cells (middle). Yellow arrowheads and white arrows depict miR-22 overexpression in young MRC-5 cells and miR-22 knockdown in presenescent MRC-5 cells, respectively. Those cells that failed to be infected are marked with white triangles. (D) Cell morphology of anti-22–infected young MRC-5 was analyzed by phase-contrast microscopy and compared with anti-C. (E) Presenescent MRC-5 cells infected with anti-C or anti-22 were subjected to SA-β-gal assay at days 6 and 14 after infection. The percentage of SA-β-gal–positive cells at day 14 after infection is presented in the bottom panels. (F) Cell morphology area and cell size distribution were analyzed using ImageJ by counting GFP-expressed presenescent MRC-5 cells after infection with anti-C or anti-22 for 6 d. Cell morphology area index represents cell size (micrometers squared). Cell size distribution was divided into three groups: 0–500, 500–1,000, and 1,000 μm2 and up. Data in all the panels represent mean ± SEM (n = 3). **, P < 0.01. Bars: (A, D, and E) 50 µm; (C) 20 µm.

