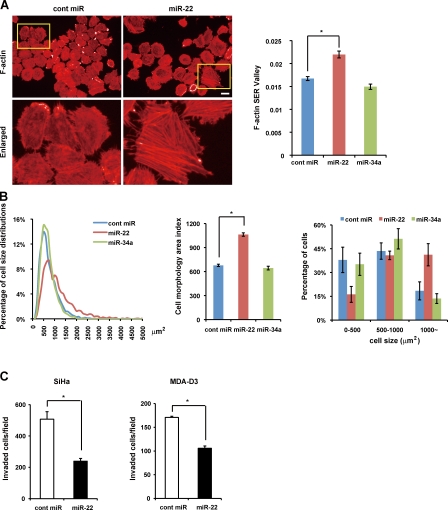
Figure 7.
Overexpression of miR-22 induces cell enlargement and inhibits cell invasion in vitro. (A) Cell morphology area and actin stress fiber formation (stained with phalloidin) in miR-22–transfected SiHa cells were examined by confocal microscopy and compared with control cells. Enlarged images of the boxed area from the top are shown in the bottom. Bar, 20 µm (top, left and right). The histogram shows that F-actin formation was quantified using the texture analysis, and F-actin SER Valley represented occurrence of stress fiber structures within cells. (B) Cell size distribution (left), overall morphology area (middle), and percentage of cells in three groups of cell size (right) were calculated and analyzed by automated image analysis in SiHa cells. (C) Effect of miR-22 on SiHa and MDA-D3 cell invasion was measured by Matrigel invasion assay for 48 h, presented by quantitative determination of the number of invaded cells. Data in all the panels represent mean ± SEM (n = 3). *, P < 0.05.

