Figure 2.
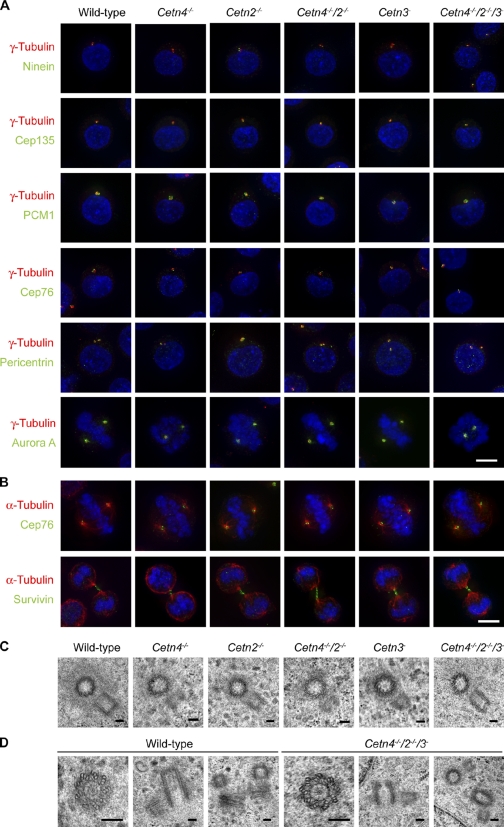
Structural integrity of centrin-deficient centrosomes. (A) Immunofluorescence microscopy analysis of wild-type and the indicated Cetn-targeted DT40 cells stained with antibodies to the indicated centrosome component (green) with γ-tubulin (red) as a reference marker. Cells were counterstained with DAPI to visualize the DNA (blue) before imaging. Bar, 5 µm. (B) Immunofluorescence micrograph of centrosomes in mitotic cells of the indicated genotype stained as in A but with α-tubulin (red) as the control. Bar, 5 µm. (C) Transmission electron micrographs of centrosomes in cells of the indicated genotype. Bars, 100 nm. (D) TEM comparison of different stages of centrosome cycle in wild-type and centrin-deficient cells. Bars, 100 nm.

