
Figure 1.
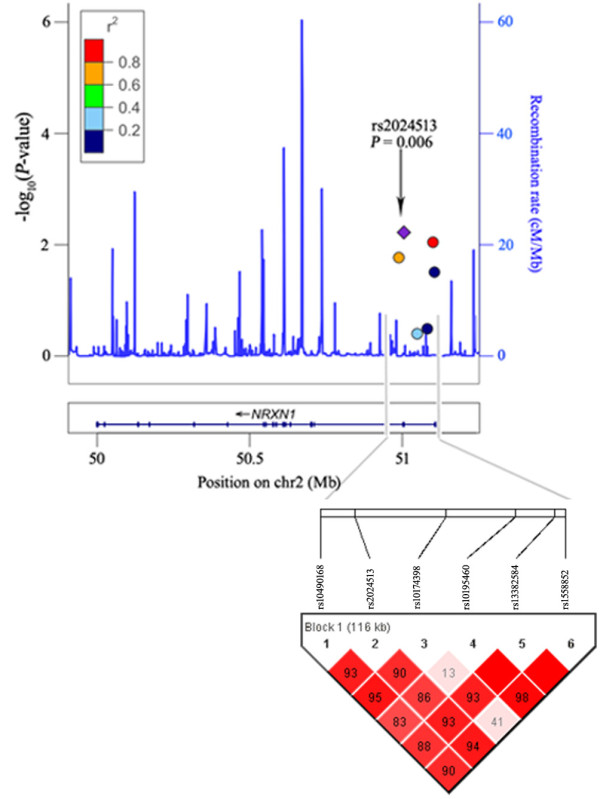
Linkage disequilibrium plot consist of 6 SNPs at the NRXN1 gene and its regional plots. Pairwise linkage disequilibrium (LD) was computed for all possible combinations of the six SNPs using D' values. Six SNPs were plotted with the -log10(P-values) in the NRXN1 genomic position (in the University of California Santa Cruz March 2006 human reference sequence, hg18). Estimated recombination rates of SNPs in NRXN1 regions (taken from HapMap Japanese in Tokyo (JPT) + Chinese Han in Beijing (CHB)) are plotted to reflect the local LD structure. The index association SNP is represented by a diamond. Color of the remaining SNPs (circles) indicates LD with the index SNP based on pairwise r2 values from HapMap data.