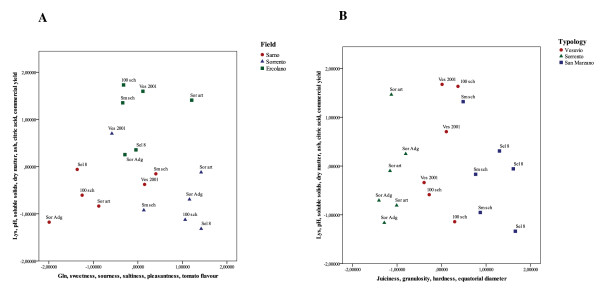
Figure 4.
Principal component analysis of the physicochemical and biochemical compounds, agronomic traits and sensory attributes, in tomato ecotypes harvested in three different fields. Axes of two-dimensional plots are derived from (A) PC-1 and PC-2, (B) PC-1 and PC-3. These factors were chosen for the best visualization of field and genotype separation and include 50% of the total information content. Plotted points represent individual samples. In scatter plot A different coloured points were used to indicate samples belonging to a same field. In scatter plot B different coloured points were used to indicate samples belonging to the same tomato type.

